Real Inflation Revealed
News
|
Posted 12/05/2017
|
8185
Inflation is one of the key metrics central banks monitor to determine how they set interest rates. Just weeks ahead of the US Fed’s June meeting we yesterday saw the 3rd month in a row of the US Producer Price Index rising faster than market expectations and the Fed’s ‘mandate’ at 2.5% YoY, the most in over 5 years. But the official PPI, just like the CPI is looking more and more ‘orchestrated’ to fit the government’s purpose and narrative.
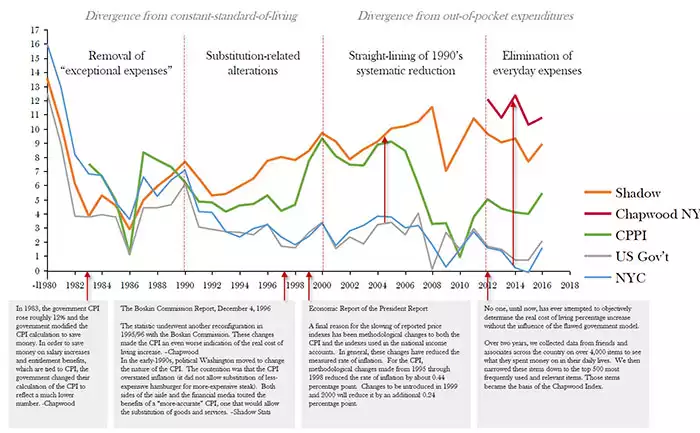
We’ve written before about shadowstats.com and their work on uncovering the myriad tweaks to the methodology to do so. Recently Devonshire Research Group produced an in depth report on this drawing not just on Shadowstats but also Chapwood and Now and Futures CPPI. It is an extensive report but some key takeaway charts and diagrams tell a clear story:

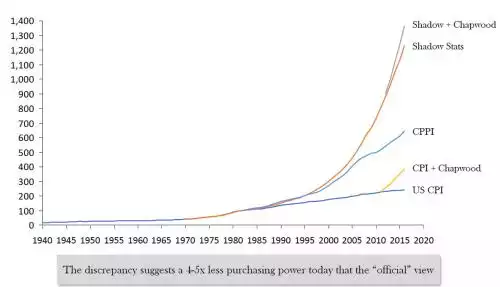
Put altogether since 1940 and you can see how ‘real’ / traditional / ‘how you feel it in real life’ measures of inflation end up as illustrated below or:
- The discrepancy suggests a 4-5x less purchasing power today that the “official” view
- And the contrarian views of total cumulative inflation suggest 5-20x less purchasing power now than in 1970

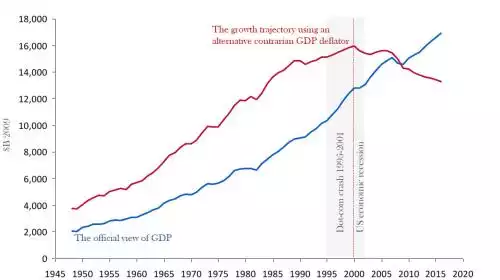
When you put this against GDP you can see the US economy never recovered in real terms since the dot-com crash and 2001 recession:

Devsonshire’s conclusion is clear and we’d hazard to guess rings true with your gut. Gold and silver thrive in inflation and the secret may be about to get out…
- “US official CPI calculation is governed, and possibly distorted, by numerous and complex technical decisions
- Inflation reporting is less a measure of purchasing power (and therefore a financial tool), and increasingly a process of affecting macro-economic policies (and therefore a policy lever)
- Real gross domestic product (GDP) measures, yield curves, and treasury issued inflation protected securities (e.g. TIPS), government and union / minimum wages all rely on official US inflation indices that are subject to these distortions
- Most financial, wealth management models rely on a price stability assumption and default to 3% inflation input – what would happen to these models if the true value was closer to 7-11%?
- If we re-compute a purchasing power CPI, de-sensationalize contrarian reporting, and remain disinterested with modern economic policies, we arrive at a 7-9% practical CPI rate over the past decade
- This has profound implications on reported vs. actual standard of living, and might explain the rapid appreciation of American consumer debt, potential reduction in perceived vs. reported quality of life, not to mention unexpected political trends
- Post-1990 inflation of 7-9%, not 3% would also suggest near “bubble-like” conditions exist across many consumer sectors;
“Expect low-cost consumer non-durable, consumables, food, housing, clothing, retail to continue to exhibit strong cost pressure and consolidation incentives – or a macro-recession causing a major “inflation adjustment black swan event””