Peaking out - the Gold Silver Ratio
News
|
Posted 27/08/2014
|
4264
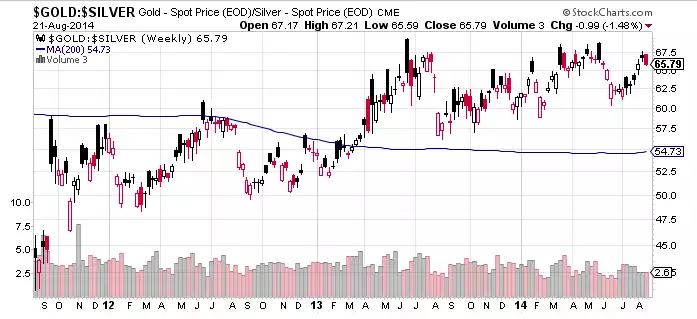
Whilst most people avidly track the gold price and silver price, fewer follow the ratio between the two. At the time of writing this morning that ratio has breached 66:1, near the top of its trading range over the last few years. Over the thousands of years that gold and silver have been used as money and wealth preservation that ratio stood at between 12 and 15 until the end of the 19th century. Since we left the gold standard in 1971 it has tracked up from the low 20’s, dipping below that only once as the Hunt Brothers cornered the market in 1980. The last time it exceeded 70, it was followed by the 2011 rally that saw silver sky rocket to $48 and the ratio down to only 30.
The chart below illustrates where we are right now from a technical view point. For technical traders you can see it is due for a move toward the mean which would see silver outperform gold from here.
There is no doubt silver is the more volatile of the pair, seeing bigger highs and bigger lows. Some people trade that behaviour and we are seeing more people swapping their gold for silver in the store here too. If you really want to get adventurous and hedge your bets a little, you could look at going short a gold ETF or futures contract and long physical silver. That way if both go down you don’t lose and if the ratio reverts to its mean you win.