One month to go
News
|
Posted 09/09/2014
|
3501
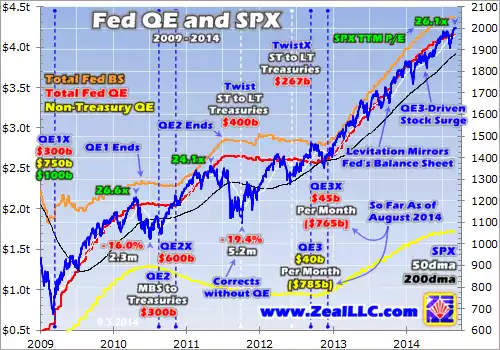
In late October the US Fed ends its biggest money printing exercise in history, Quantitative Easing. It commenced straight after the GFC and since then has seen the Fed’s balance sheet go from $875b to 4.38 trillion – i.e. they printed out of thin air $3.5 trillion! In its third guise QE3 was the only open ended program and the largest, and it ends on 29 October.
So what could happen?
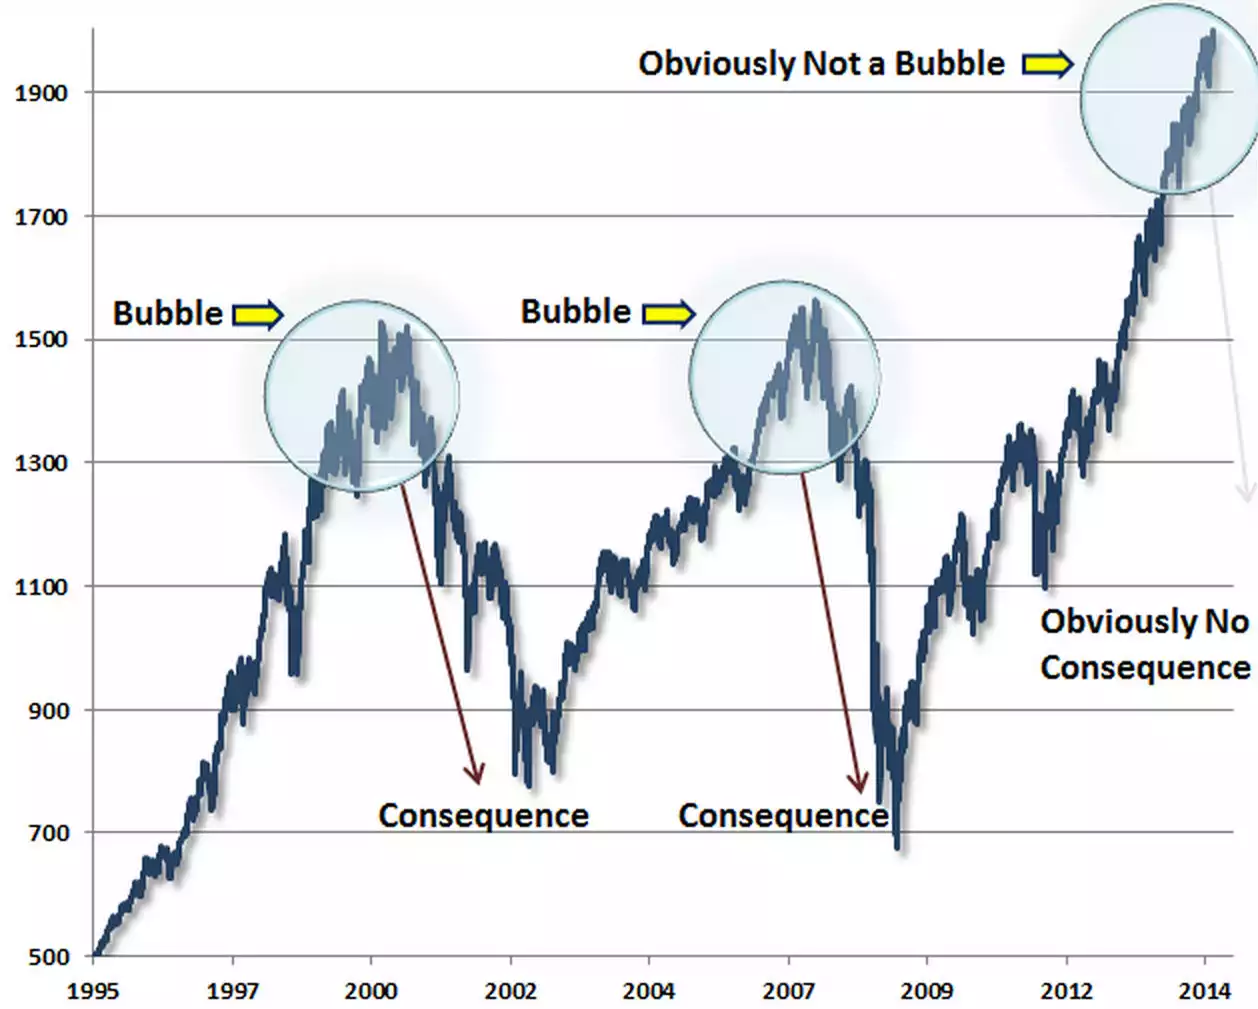
Well on the completion of QE1 and QE2 the US sharemarket tanked with the S&P500 off 16% on QE1 and 19% after QE2. Why? Because the printed money was used to prop up the sharemarket whenever it naturally faltered. Take that money away and there is no one left. The graph below depicts the relationship of the S&P500 (blue line) and the QE program (red line). Many argue it’s different this time but the Fed doesn’t even have rates to play with if it’s not, as they are near zero already.
And it’s not like things are necessarily ‘better’ now either as price earnings are as bad now as the last 2 corrections at nose bleed 26:1 levels. The second graph (ZeroHedge) too puts the current market into perspective. So whether to move some of your money out of shares into gold and silver is whether you really believe it is different this time… (and yes these are US sharemarket graphs but we all know the US sneeze / Aussie cold saying…).