Onchain Activity Demonstrates Healthy Recovery for Crypto
News
|
Posted 19/04/2022
|
6478
The Bitcoin market traded lower this week, coming off an opening high of $47,102, and slipping to a low of $42,183. This market weakness follows a relatively modest price break-out from the multi-month consolidation range that has been established since mid-January.
A powerful set of tools for tracking the cyclical nature of Bitcoin cycles is on-chain activity, broadly described as the utilisation of block-space via active network participants sending transactions and settling values. Metrics that describe this include active addresses/entities, transaction counts, mempool congestion, and fees paid.
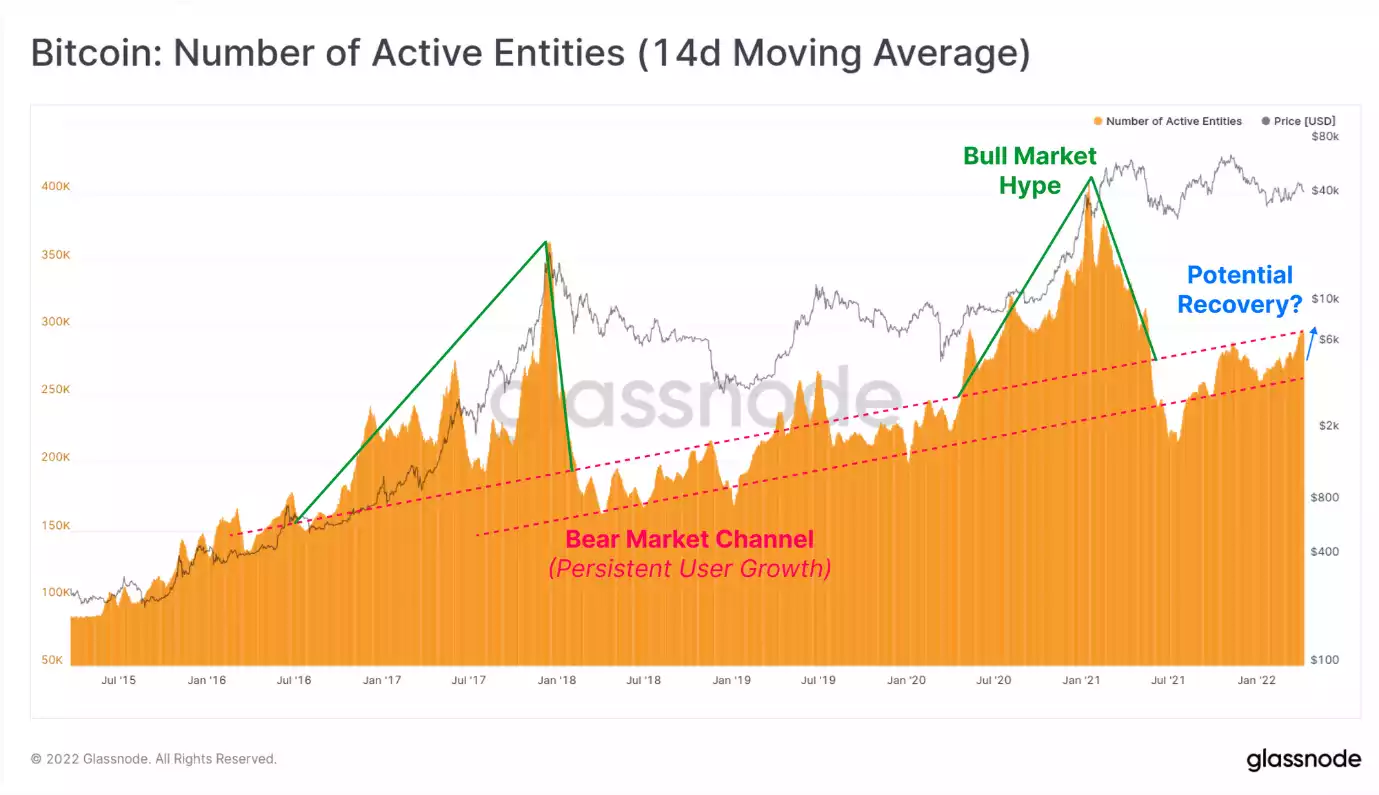
The number of active entities remains within the bear market channel that has been established over the last six years. That said, the current active entity count of 296k/day is at the upper end of this channel, and a sustained expansion higher would be constructive. Despite this, we are still seeing persistent user growth.

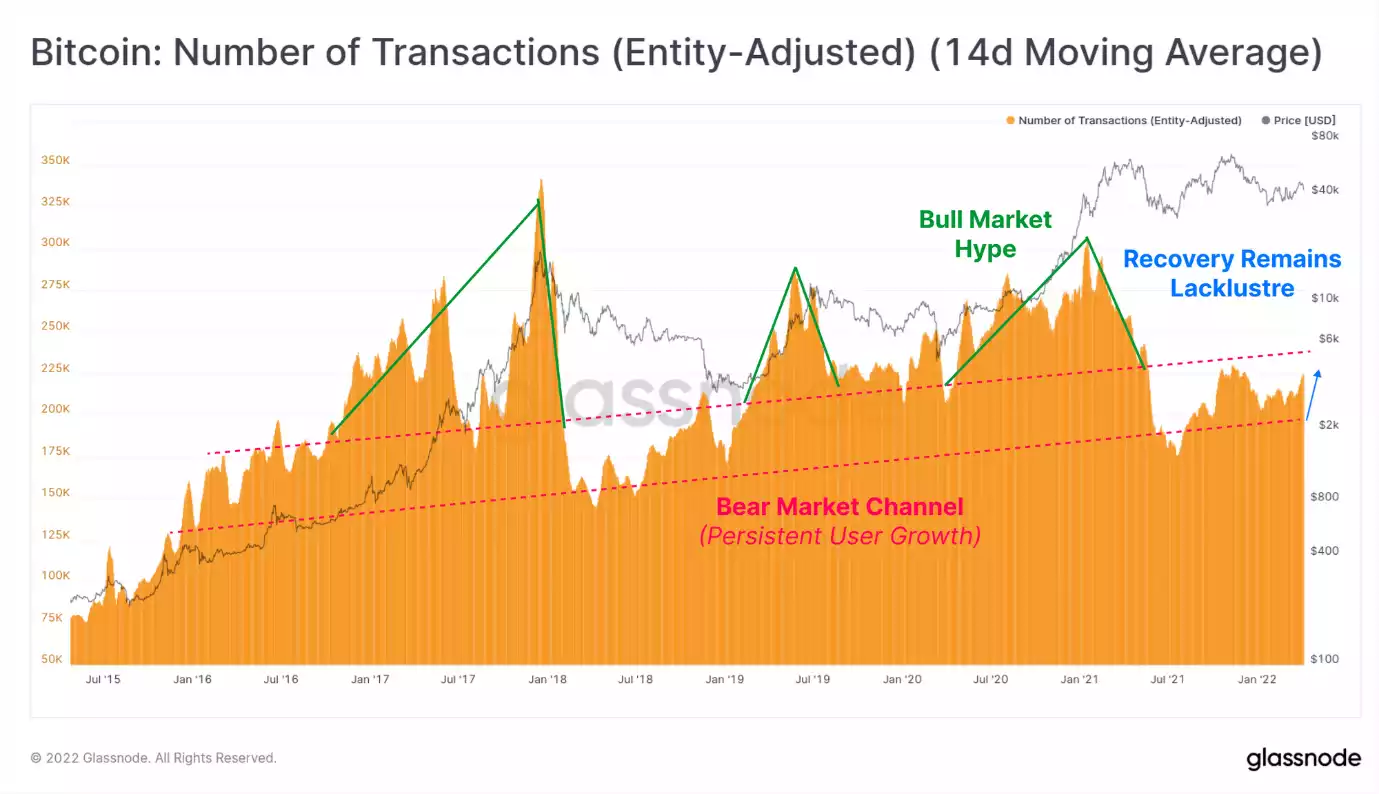
Transaction counts are also relatively low, currently at around 225k transactions per day, which is similar in magnitude to during the 2019 bear market.
What is interesting to see is that over the longer-term macro time-scale, both of these on-chain activity metrics continue to climb, even during bear market trends. This signals a persistent growth in the HODLer user base. HODLers are those investors who are relatively price-insensitive and are active Bitcoin users and accumulators irrespective of market conditions. This is a great sign of a maturing market – a market with less violent drops, favouring drawn out and complex bottoming batters (like we are experiencing right now).

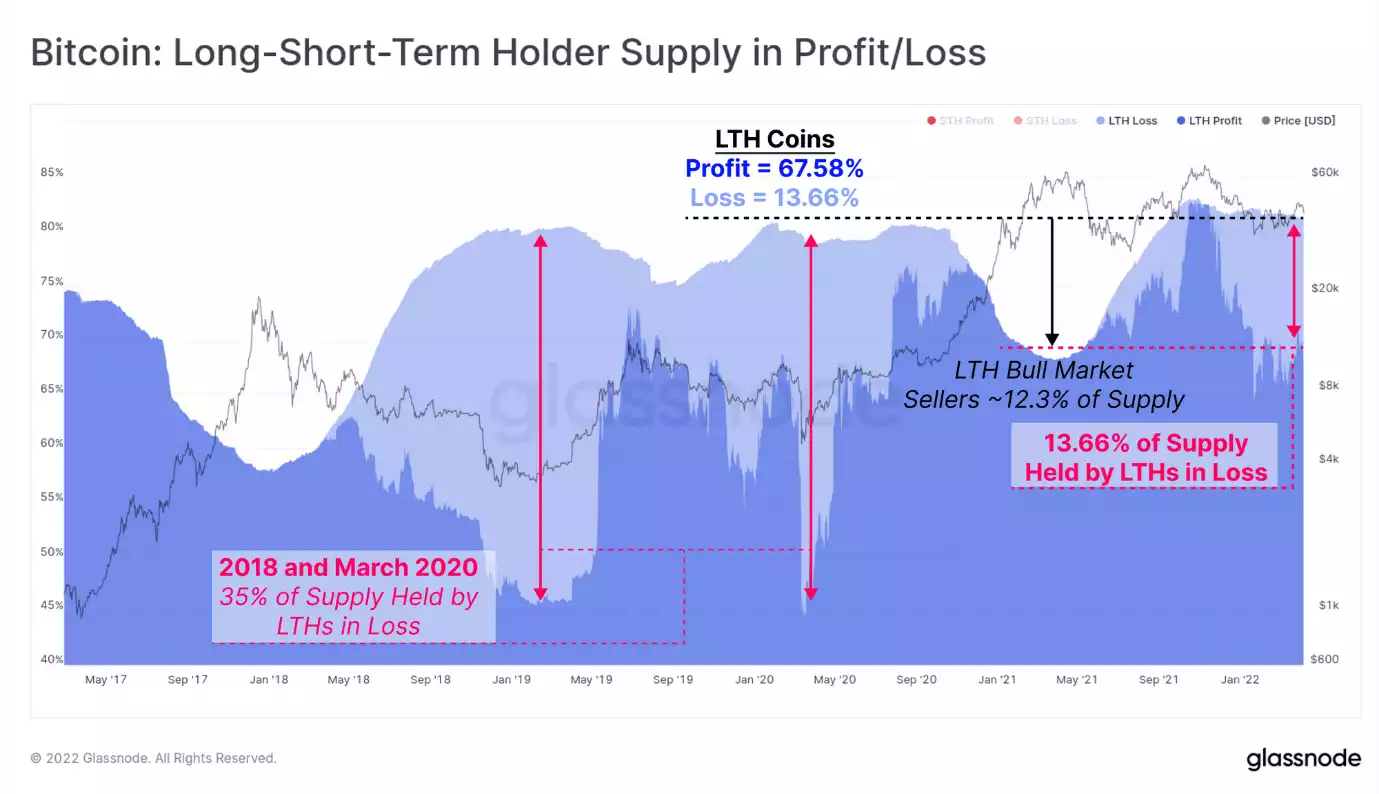
Bitcoin Long-term holders (LTHs) currently hold 13.66% of the supply that is at an unrealised loss, which is a sum approximately equal in magnitude to the amount of sell-side they applied in the 2020-21 bull market. LTH coins are the least likely to be spent and sold on a statistical basis, and it can be seen in 2018 and March 2020 that they have held through much deeper losses in the past.
The proportion of LTH coins held at a loss reached over 35% of supply in the depths of previous bear cycles, which is 2.5x more relative coin volume than we have in the current market.

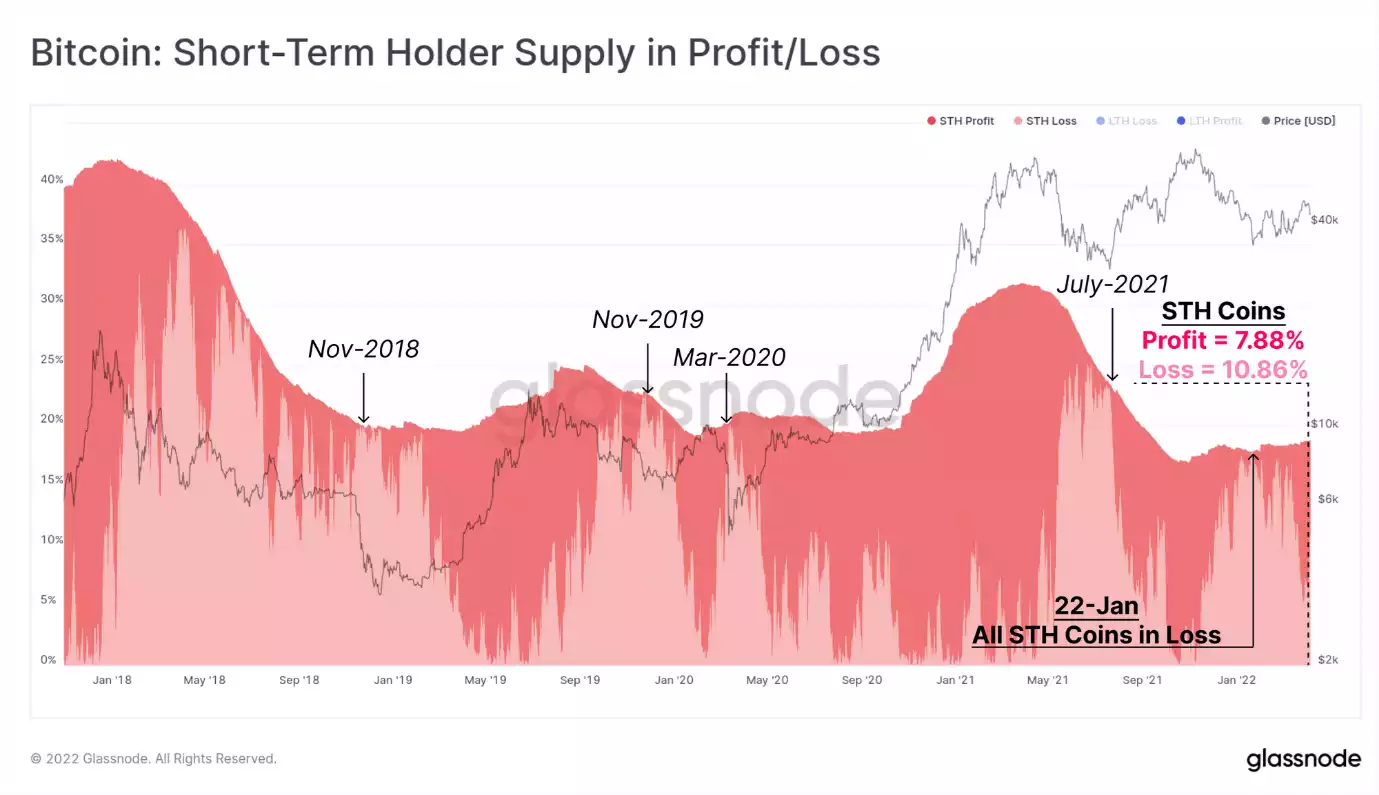
Short-Term holders (STHs) own far fewer coins compared to LTHs (18.74% of supply), however, this cohort has seen a marked jump in profitability. As the market rallied out of the consolidation range, new accumulators (STHs) that acquired coins between $33k and $42k have returned to an unrealised profit, showing that investors saw value in that price range.
This is a positive development compared to the recent market lows on 22-Jan, where 100% of all STH coins were at a loss. Improving investor profitability, especially in this more price-sensitive STH cohort tends to lower the probability of panic-driven sell-side pressure.

The Bitcoin market has pulled back this week after a break-out from the multi-month consolidation range. Prices have thus far struggled to find much sustained upside momentum, and there are indications of a modest volume of profit-taking by investors. Especially across on-chain activity metrics like transaction counts and active users, the recovery has thus far been relatively slow and continues to suggest Bitcoin is a HODLer dominated market, with few new investors flowing in.
That said, network profitability has improved indicating significant re-accumulation took place since January. The aggregate profitability of the network remains in a far healthier position compared to prior bear cycles. The market has opted for a slow and complex bottoming pattern – use it to your advantage!