Math, Risk and Return of Capital
News
|
Posted 16/09/2020
|
7783
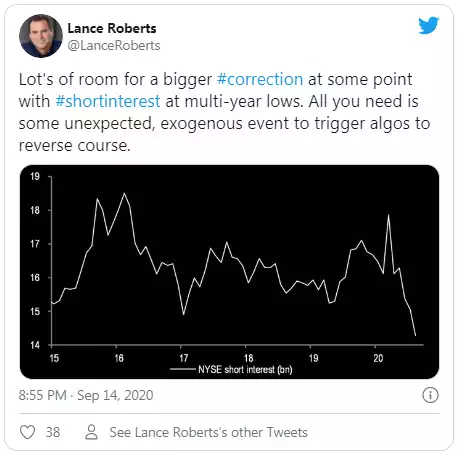
After this recent Wall St correction the futures markets are telling us the herd are now bullish again with short interest on the NYSE falling sharply. As Real Investment Advice’s Lance Roberts tweeted below, that leaves little room for tolerance of any unexpected further falls:

Such a setup implies the market sees that correction as returning shares to fair, buyable value despite valuations remaining sky high and a host of risks still at play. Roberts agrees there is real potential for another rally from here but adds that the risks are very real to the downside:
“Lot’s Of Risks To The Bullish Outlook
While we used the sell-off to add some holdings to our portfolios, we remain cautious for several reasons.
- The market has fully priced in whatever economic recovery we are likely to see near-term.
- There is clear evidence of weakening economic data and slower earnings growth.
- Investors are counting on a “vaccine” to restore the economy to its previous strength fully.
- The markets have entirely discounted the potential for an election “event.”
- Market participants have discounted the need the additional stimulus to sustain economic growth and recovery.
- The Fed is on the sidelines for now. Without additional Treasury issuance, the Fed has less ability to provide additional liquidity to the market.
- While the economy is indeed recovering, along with employment, it will still likely fall well short of pre-pandemic levels stifling future earnings growth and revenues.
- Investors are paying exceedingly high valuations based on a full earnings recovery, which is unlikely to be the case.”
They argue to that those sky high valuation imply sky high future earnings. The problem is that is highly unlikely.
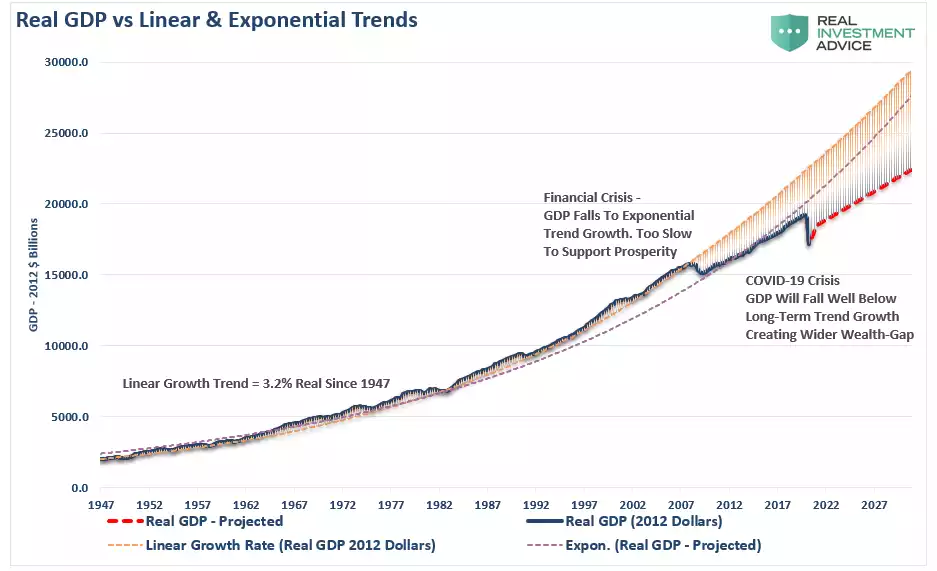
“The problem [is] the ability for stocks to continue to grow earnings at a rate to support such high valuations is problematic. Such is due to rising debts and deficits, which will retard economic growth in the future. To wit:
“Before the ‘Financial Crisis,’ the economy had a linear growth trend of real GDP of 3.2%. Following the 2008 recession, the growth rate dropped to the exponential growth trend of roughly 2.2%. Instead of reducing the debt problems, unproductive debt, and leverage increased.
The ‘COVID-19’ crisis led to a debt surge to new highs. Such will result in a retardation of economic growth to 1.5% or less.”

In typical pragmatic fashion Roberts reminds us of some basic math and risk assessment.
“Overall, our assessment remains one of caution. In the short-term, we could well see an oversold bounce that could even recover back to the previous highs.
However, we suspect that given the rather numerous headwinds currently facing the markets, from the Fed to the election, that a failure at lower highs would not be surprising.
While we did add some exposure near the lows, we will be using the rally to sell into and increase our portfolio hedges heading into the election.
If you disagree, that is okay.
However, these are the questions we ask ourselves every time we add exposure to portfolios:
- What is the expected return from current valuation levels? (___%)
- If I am wrong, given my current risk exposure, what is my potential downside? (___%)
- If #2 is greater than #1, then what actions should I be taking now? (#2 – #1 = ___%)
How you answer those questions is entirely up to you.
What you do with the answers is also up to you.
Ignoring the results and “hoping this time will be different” has never been a profitable portfolio strategy.”
We remind you from numerous articles that present historic precedent in the sorts of falls one could expect from such a sell off where 40-80% is the norm.