Where do I put my money? – Gold Bull Market Still Intact
News
|
Posted 08/12/2020
|
6397
This would have to be one of the most common questions investors have asked this last year. Shares are at record high valuations despite a recession, bonds are all sky high and for the same reason bonds aren’t yielding, you can’t get any interest on your money in a bank either. “Where do I put my money” is what leads so many people to our door.
Crescat call this Risk Parity Exhaustion and spoke to it recently in an investor update as follows:
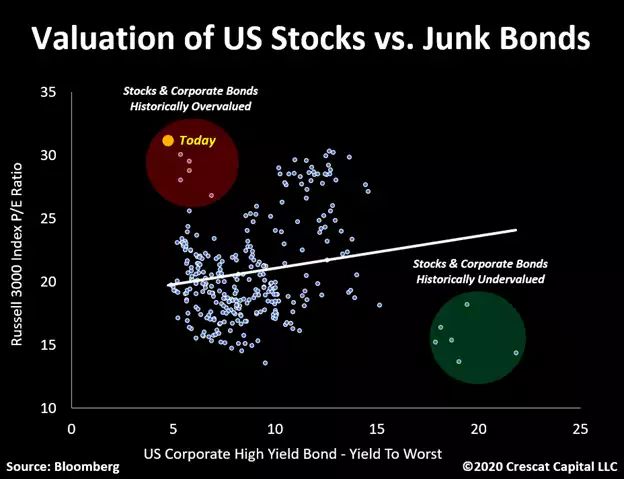
“Among all the demand drivers for gold, we view the lack of competing cheap assets being a major one. For the first time in history, junk bonds and stocks are record overvalued in tandem. Both sides of the so-called risk parity strategy, stocks and bonds, are at extreme valuations. In a world of near zero to negative yields and frothy valuations across almost every risky asset, it will become imperative for investors to seek out undervalued assets that are true beneficiaries of the current macro environment. In our view, precious metals are poised to become the new core must-have asset for capital allocators. Gold and silver are risk-off alternatives to bonds in the portfolios of prudently minded investors in today’s market.”
When you see a chart like that below illustrating their point above, you really ‘get’ the extreme set up before us right now. The most ardent believer of ‘this time is different’ (the 4 most expensive words in the English dictionary) must take serious pause at this…
Crescat go on to note:
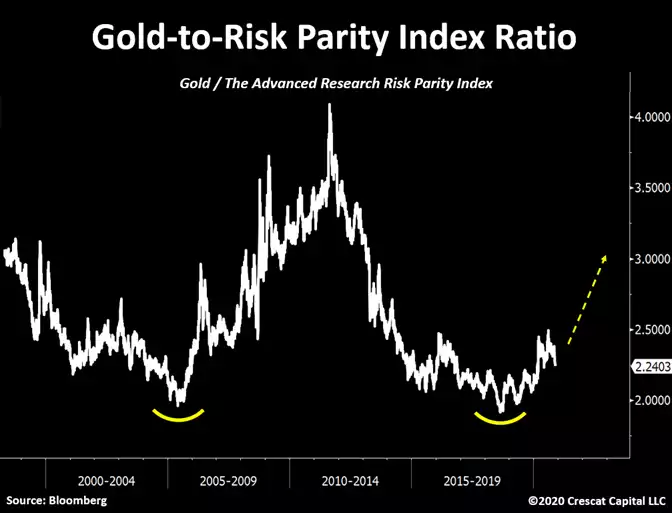
“After 2011, the gold to risk parity ratio went through a precipitous downward trend that began to reverse in the fourth quarter of 2018. This ratio seems to have formed a double bottom and now [see the chart below], in our view, is poised to move significantly higher. We believe that within the next few years, investors will trade historically overvalued stocks and bonds for cheap macro assets such as precious metals.”
So extreme is the corporate bond market right now, that for the first time in history, yields on them are below the inflation expectations…
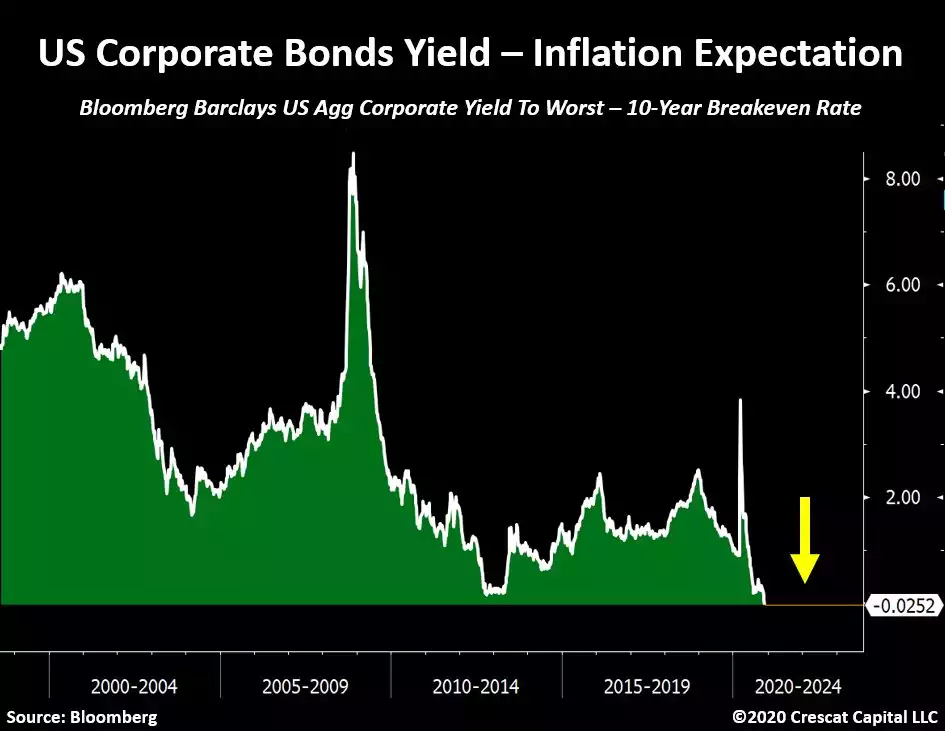
Just pause and consider this. So desperate is the market looking for a home for funds that yields, they are piling into risky corporate debt at yields, whilst better than a bank, are in fact less than the 10 year break even rate, a good proxy for future inflation expectations.
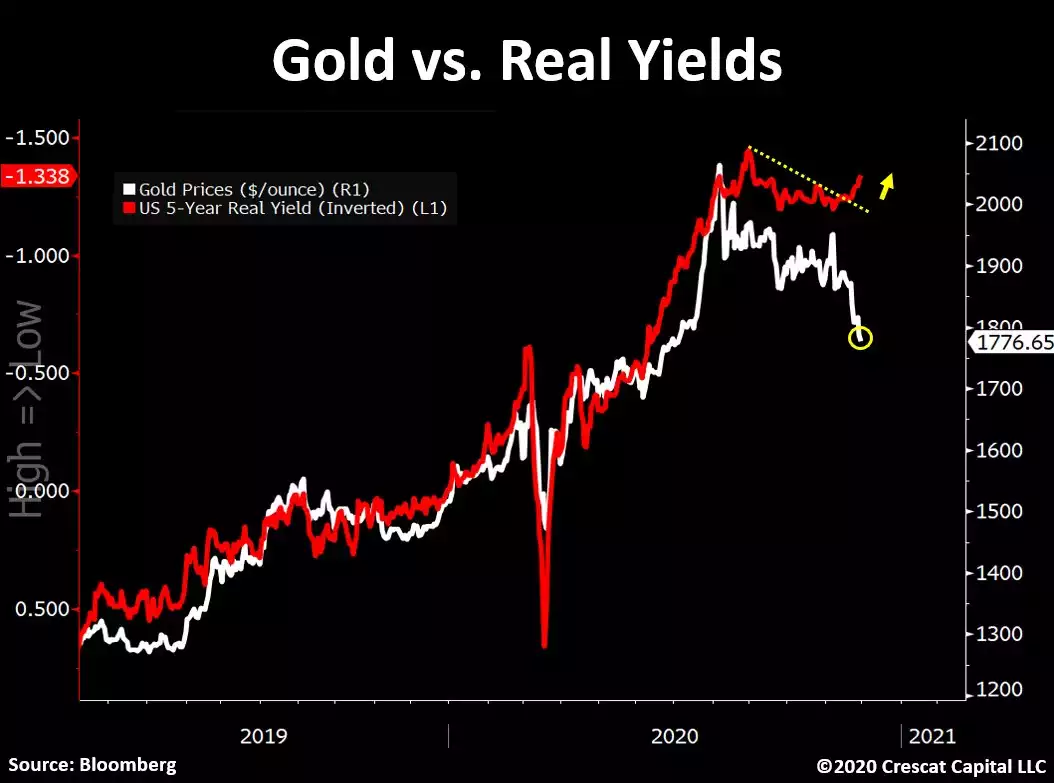
Gold has had a good correlation of price against real yields but the chart below clearly illustrates how the correction in the gold price since July has broken from that correlation and suggests a strong rebound is imminent.
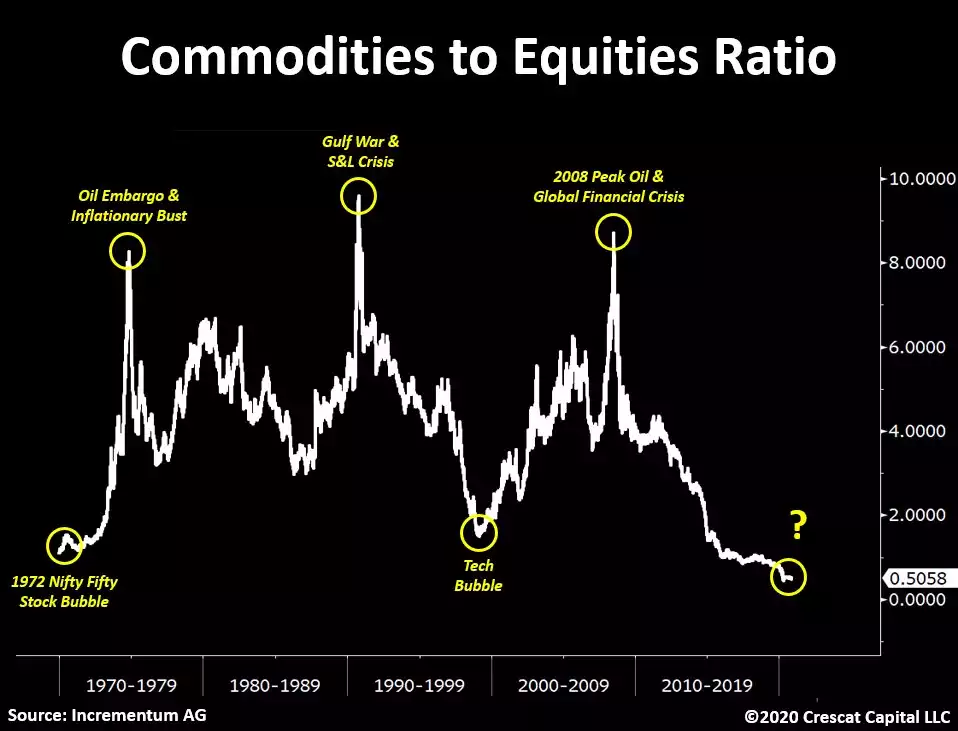
As opposed to sky high shares and bonds, the collective of hard assets being the commodities index, has never been lower compared to shares per the chart below:
And hence any talk of gold (and silver in particular) having ‘had its run’ this year looks extraordinarily premature. The chart below (in log scale) shows the last bull run in gold from 2001 to 2012 followed by the bear market to the end of 2015, and this bull market starting then.
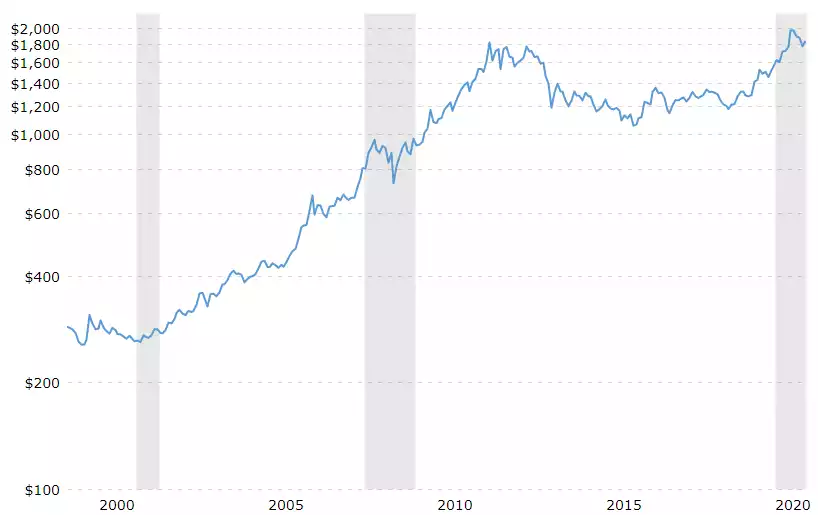
That chart illustrates how early we could be in this bull market and puts the correction this second half of the year firmly into perspective. Crescat more clearly illustrate how these +10% corrections were par for the course last bull run, illustrating no less than 6 of them before the top.
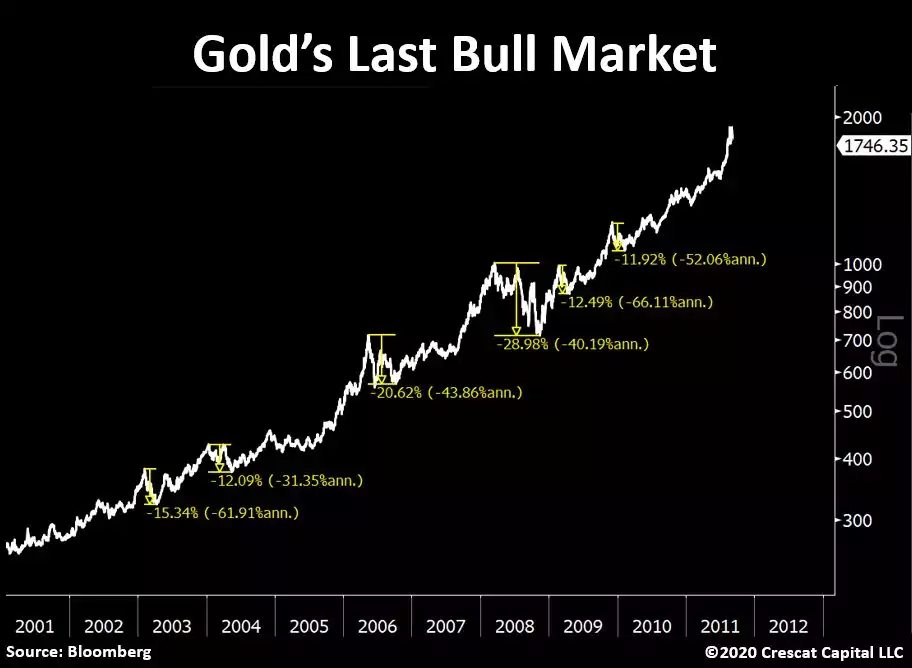
As the author, Otavio Costa tweeted today in reference to this chart:
“So much for the end of the bull market on gold.
Here are the other 6 times gold fell more than 10% in its last cycle.
Mute the noise.
It’s time to own precious metals.”