Listen to the Market
News
|
Posted 17/03/2021
|
5913
The market is nervously awaiting the outcome of tomorrow’s US Fed meeting. Will they be dovish (easing) or hawkish (tightening)? Will their view of the economy be bullish or remain cautious. And the golden question… will they start to project raising rates in 2023… ??
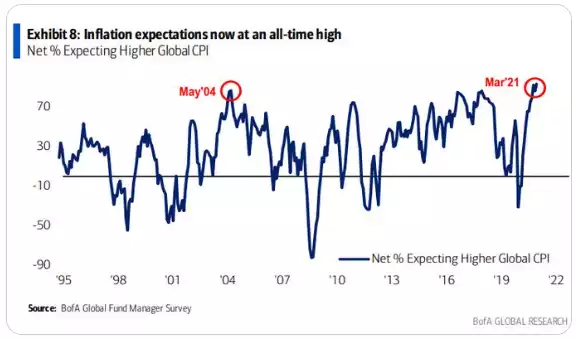
BofA’s fund manager survey inflation expectations are now at an all time high…
The chart below of the NASDAQ v S&P500 shows “we are sitting on an incredibly important turning point" according to Larry McDonald noting "the world’s first and second most liquid and arguably most important stock indices are sending important rotation signals. In our view, both tech and growth equities outperformance run is over and the rotation to value and commodity exposed equities has begun."
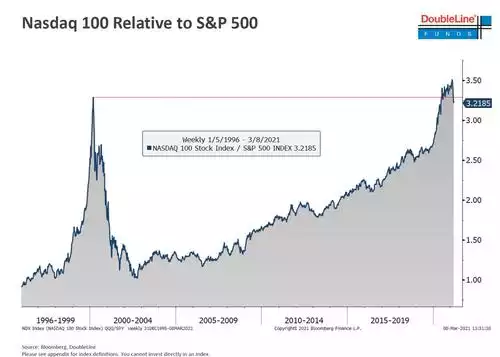
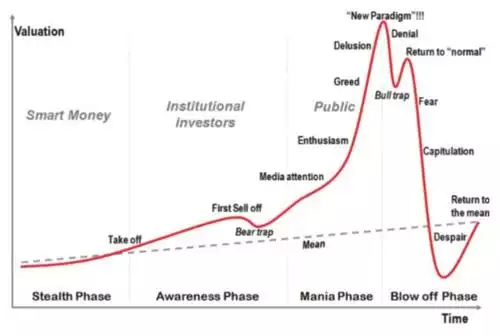
Last time that happened the S&P500 didn’t peak for over a year afterwards but the NASDAQ fell over 50%. Eventually the whole market falls but the timing is unknown. Does the leverage and ‘all in’ now mean a faster overall crash? Frankly, no one knows. What is worth looking at for further guidance is a zoom out to previous full market cycles, not these micro cycle ‘distractions’. First let’s revisit the oft repeated cycle psychology playbook:
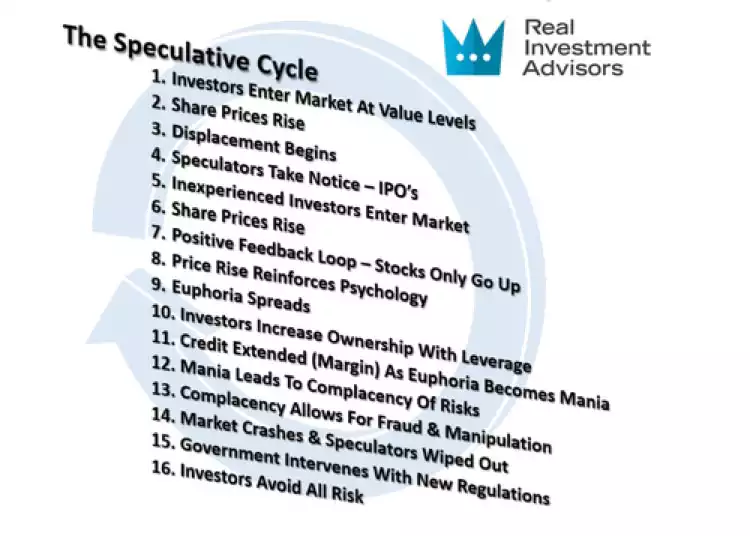
Real Investment Advisors spell that out as follows:
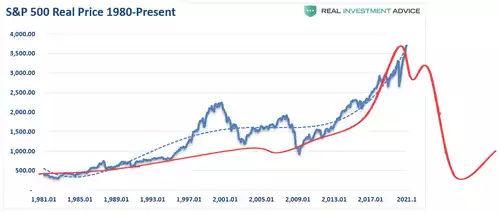
They then look at Full Market Cycles. The first chart below shows the real (i.e. inflation adjusted) returns on the S&P500 since 1871 together with the CAPE ratio.
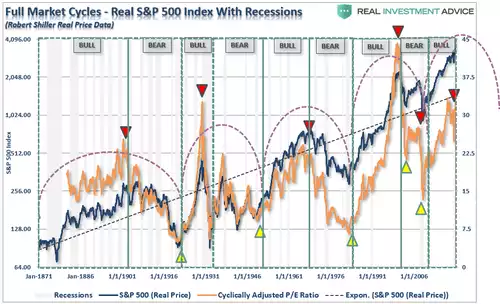
As you can see it is showing how we may be at a bull market top right now. They then zoom out further and consider a cycle as one of 2 halves, the bull and the bear ‘super’ cycles.
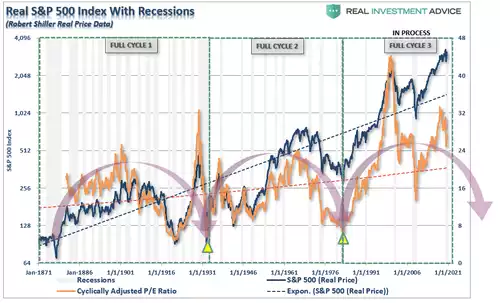
This chart suggests we are only part way through that super cycle and about to head into the bear phase that takes value or earnings back to nil in real terms as happened in each of the previous two. Applying the market psychology chart above to each of the previous market cycles and it looks like this:
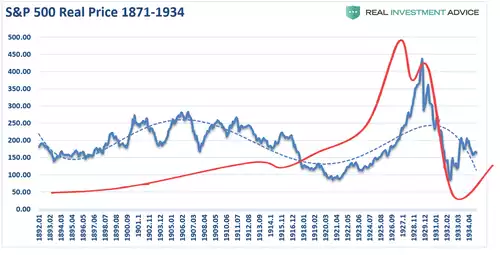
“The first full-market cycle lasted 63-years from 1871 through 1934. This period ended with the crash of 1929 and the beginning of the “Great Depression.””
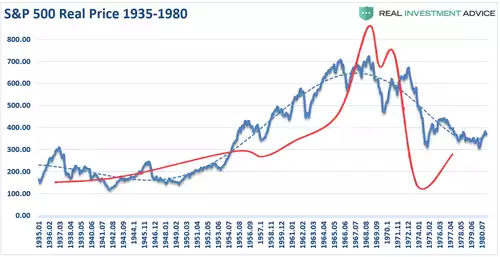
“The second full-market cycle lasted 45-years from 1935-1980. This cycle ended with the demise of the “Nifty-Fifty” stocks and the “Black Bear Market” of 1974. While that crash was not as economically devastating as 1929, it significantly impaired investor psychology.”
“The current cycle is only 40-years in the making, which is younger than both previous full market cycles. Given markets are trading at the 2nd highest valuation levels in history, corporate and consumers heavily leveraged, with economic growth rates running near historical lows, it is worth considering forward returns over the next decade.”
REA go on to stress that whilst market psychology certainly repeats or rhymes, the actual cause of the bubble bursting is rarely the same nor what many may predict, usually because they are applying lessons from previous crashes that shouldn’t be repeated. Market researcher Bob Bronson’s car crash analogy is a great one:
“It can be most reasonably assumed that markets are efficient enough that every bubble is significantly different than the previous one. A new bubble will always be different from the previous one(s). Such is since investors will only bid prices to extreme overvaluation levels if they are sure it is not repeating what led to the previous bubbles. Comparing the current extreme overvaluation to the dotcom is intellectually silly.
I would argue that when comparisons to previous bubbles become most popular, it’s a reliable timing marker of the top in a current bubble. As an analogy, no matter how thoroughly a fatal car crash is studied, there will still be other fatal car crashes. Such is true even if we avoid all previous accident-causing mistakes.”
We can try and figure out what will be the pin for this bubble, be that tomorrow’s Fed meeting or whatever this or next week’s headline is, but the reality is that it doesn’t matter. The market will behave like a market has always behaved, that’s just human psychology. The ones who will survive are those who don’t try to be smarter than the market but balance their wealth for any possibility. Those that thrive in the longer term will weight that balance toward the current signals charts like those above are trying to tell you through all the ‘everything’s awesome’ and ‘don’t fight the Fed’ narrative. That means assets that thrive in such conditions; safe haven, self inflation hedging, hard assets.