Is The US In Recession NOW?
News
|
Posted 21/04/2017
|
5655
Following on from yesterday’s article on the IMF’s Global Financial Stability report, today we discuss a key figure in that report putting the current cycle into context.
What seems so apparent to us with so many of the charts we present to you is that the US, on a comparison with previous metrics, looks like it is in a recession now. Whilst the 0.5% GDP predicted for Q1 2017 by the Atlanta Fed is perilously close to zero growth and both soft and hard economic data is turning down, as we discussed yesterday markets are ignoring the signals seemingly based on hope. That was evidenced last night with Wall St surging simply on comments by US Treasury Secretary Mnuchin that they will still reveal their tax reform before the end of the year. The market is unconcerned that, like the failed health care changes, this still needs to get through a hostile congress. Hope, it seems, prevails again.
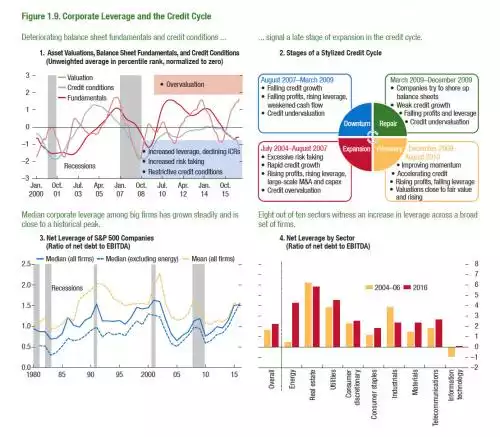
So let’s look at the Figure below. We discussed the bottom left chart yesterday and the bottom right simply shows how widespread the issue is across most sectors. But check out the top left… yet again the last times we had valuations so high, credit conditions so bad and fundamentals falling like they are, the US was IN a recession.
The top right graphic walks you through a (sub) credit cycle (we say sub as we believe we are in a far bigger credit super cycle that started when the gold standard was abandoned in 1973).
The graphic is notable for two main reasons. Firstly the usual expansion (red) characteristics this time haven’t seen the usual strong profit growth yet markets have acted like we have, and secondly, as we discussed last week, we are seeing the characteristics of a downturn playing out right now.
The trillion dollar question is… when will the market realise?