Hi ho Silver!
News
|
Posted 17/02/2017
|
6698
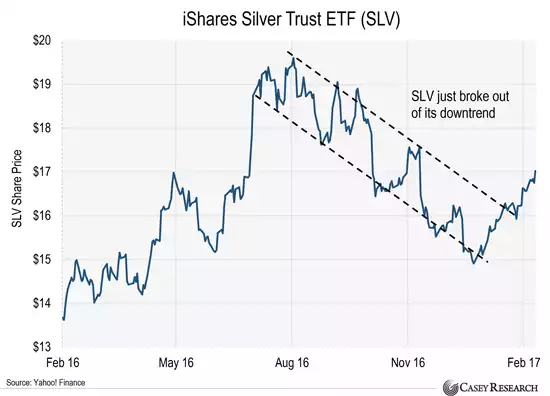
Silver is again outperforming gold this year being up 13% already compared to gold up 8%, and seeing the gold silver ratio dropping from early 70’s to 68.4 today. That of course is still well above the last low of 30 in 2011 and the 100 year average of around 45. As you can see in the chart below silver has broken through a critical trend line (using SLV as a proxy):
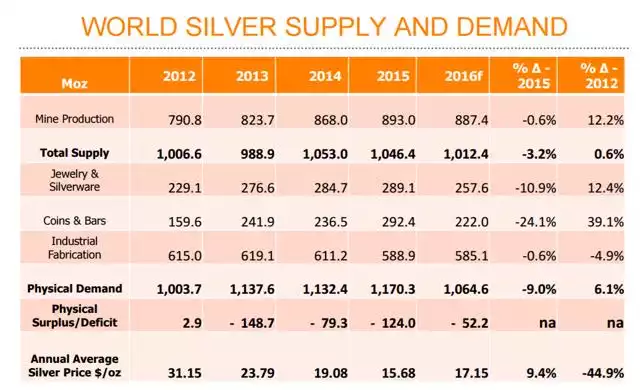
Unlike gold, silver has 2 masters – both investment/jewellery and industrial. The pick up in global industrial production growth this year may be part of the support but it would appear ‘paper’ silver investment growth through the likes of SLV above and futures trading on COMEX is even bigger with the latter up 3,500 tonnes just this year to date. Because most COMEX trades don’t see a single physical troy ounce of silver exchanged in most deals, that 3,500 tonne doesn’t show up in the likes of GFMS’s supply & demand reports. So for context 3,500 tonne is about 112.5 million troy ounces. Checking out the table below, you can see that total coins and bars (physical investment) last year was only 222m oz!
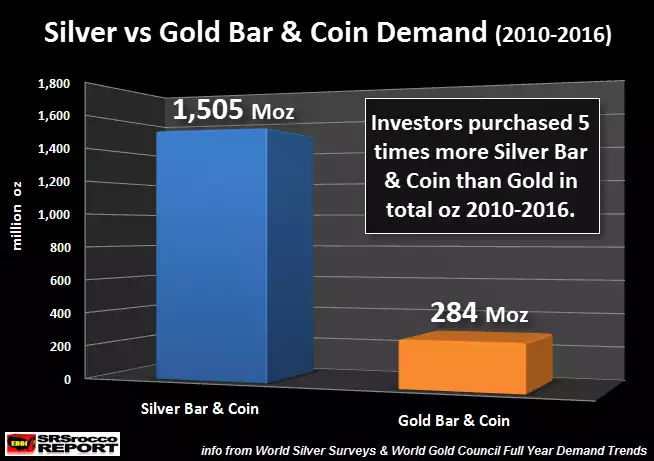
The graph below puts that into context for last year:

Its not an enormous stretch to establish that with any shock to the system that a large portion of that paper silver may demand the metal and may cause a shock spike in demand not currently captured in the demand table above.
So what happens when demand spikes? The US is, like it or not, the epicentre of silver investment demand. The graphs below walk you through the silver supply / demand landscape in the US and globally compared to gold (but remember China is the king of demand for gold). Firstly the US is a big net importer of silver:

Secondly the demand for silver well exceeds that for gold:
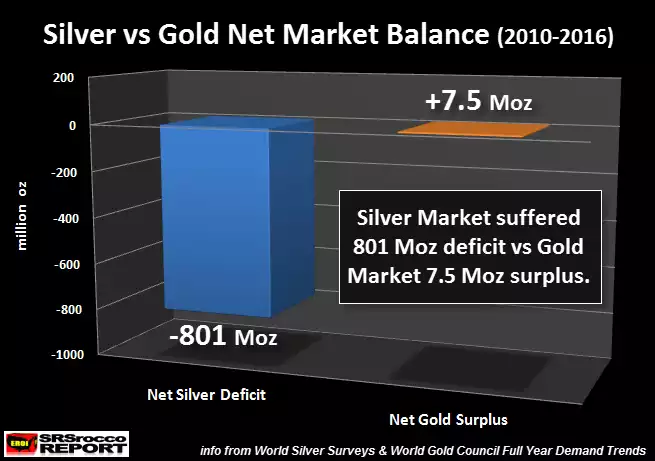
It’s always interesting to compare that demand figure (5x silver to gold) with the aforementioned gold silver price ratio (GSR) of 68x gold to silver. From both a supply and demand perspective there is no nexus with that GSR. Now that said, we have read enough analysis by respected Chinese experts such as Koos Jansen to believe that the World Gold Council greatly understates the gold demand by China, but regardless, that in itelf does not justify the current GSR. The final graph paints a very clear picture:
The silver market, quite simply, looks unable to meet any shock in demand. In the economics 101 supply:demand:price dynamic that only leaves price as the variable….