$3000 Gold “The Fed can't print gold” – Bank of America
News
|
Posted 22/04/2020
|
29844
Last night Bank of America Merrill Lynch released a report titled “The Fed can't print gold” and increased their previous forecast of $2000 to $3000 within 18 months, nearly double the current $1680. A longer piece today, we somewhat abbreviate below.
Gold prices have performed well during the recent period…
As the ultimate store of value, gold prices have performed well during the past 15 months, posting a rally of 12% since the Federal Reserve did a monetary policy U-turn in January 2019 (Chart 1). More recently, gold prices have continued to post a robust run, with returns broadly outpacing other major asset classes year-to-date (Chart 2).

…except over a brief window where liquidation occurred
Of course, it has not been a straight line up for the yellow metal. In fact, gold prices sold off very hard with close to 5 million futures trading volume during the March 9th to March 19th window (Chart 3) on the back of a major liquidity crunch.

The sell-off in gold prices mirrored the move in real rates
It is worth noting too that the drop in gold prices mirrored the move in real interest rates during the past two months (Chart 5). As investors feared the extension of the China lockdown to the US and the rest of the world economy, asset values and consumer price expectations collapsed faster than nominal interest rates, triggering fears of an economic depression. Having learned the lessons of the Global Financial Crisis (GFC), the Federal Reserve raced to expand its balance sheet to increase fixed income liquidity and reflate US asset values, ultimately supporting a sharp recovery in gold prices (Chart 6). [TIPS - Treasury Inflation-Protected Security are a Treasury security issued by the U.S. government indexed to inflation]

Gold is a function on real rates, USD, commodities and risk…
As explained above, the selloff and subsequent recovery in gold prices during March was somewhat mechanical in nature. As the ultimate store of value, gold is a reflection of market movements across all major financial and physical assets. In the past we have argued that gold volatility is a function of real interest rates, USD, commodities and risk (Chart 7). Swings in these four variables alone can help explain up to 80% of variation in weekly gold price changes (Chart 8), providing an important template to understand the direction of future gold prices.

Gold interacts with all financial markets in different ways
Gold interacts with various financial markets in different ways. For instance, we recently noted that the correlation between gold and equities has recently turned positive (Chart 13). The positive equity/gold correlations are a possible sign that equity markets may not have fully bottomed (Chart 14) and that the gold market has further room to run, in our view. The trigger here could be an extension of lockdown restrictions over the next few weeks.

Despite the rally, gold positioning has been surprisingly weak
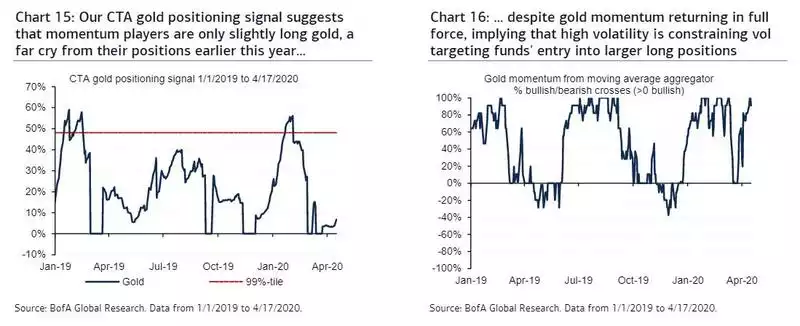
Another reason to be particularly constructive on gold is that our CTA [commodity trading advisor] gold positioning signal suggests that momentum players are only slightly long gold (Chart 15). Having peaked at 56% of their maximum length in the month of January, our models suggest that momentum players are currently holding 5.7% of their maximum allocations, well below the historical 99th percentile in history of 48%. While gold momentum is in full force following a brief collapse mid-March (Chart 16), our CTA model has only slowly crept into a long position due to the prevailing high volatility regime, a feature that is also likely prevalent in the broader class of vol targeting funds.
Fundamentally, EM gold demand should continue to be soft…
Also, jewelry demand usually declines when prices rally, as buyers in emerging markets like India often purchase on a budget.
…as purchasing power in India and China is suffering
Similarly, sales of jewelry in China, the second largest physical market, have been subdued for a while on persistent headwinds to growth which have been exacerbated by the health emergency in the first quarter
…although we expect central banks to buy some gold bars
So physical demand in traditional gold markets like jewelry looks soft and could be a drag on precious metals prices. However, central banks across major emerging markets have been avid buyers of gold for their reserve portfolio (Chart 25). As central banks in developed markets have expanded their balance sheets to support domestic asset and consumer prices (Chart 26), some EM central banks have become more proactive buyers of precious metals. In particular, Russia, China and India have opted to increase gold holdings in the past 5 years to diversify away from G-10 sovereign bond positions.

Gold may take comfort on rising inflation expectations…
We have previously argued that inflation expectations embedded in US TIPS collapsed and then rose again as the Fed acted to backstop fixed income asset values (Chart 29) and consumer prices. Now, with the Fed committing to do whatever it takes to prevent widespread bankruptcies across the US, Congress injecting a $2tn fiscal stimulus plan, and economic growth on standstill until there is a cure or a vaccine, inflation could rise even if GDP does not. This backdrop should prove very positive for gold, in our view. Similarly, the sharp increase in the ECB balance sheet in recent years, coupled with the likely massive expansion ahead, should provide strong support to gold (Chart 30).

…driven by massive monetary easing plans around the world…
One of the most intriguing developments ahead is that US GDP could drop by 30% YoY in 2Q20, the steepest collapse ever in modern history. Other countries like Japan will likely experience a 21.8% decline in output, while China just reported a contraction of 6.8% in 1Q20. As central banks rush to expand their balance sheets and backstop the economy, a lot of risks could effectively be socialized, boosting the appeal of gold. In aggregate, major central bank balance sheets have been stable at around 25% of GDP for the last decade or so (Chart 31). But clearly Covid-19 has started a race to increase balance sheets and save domestic asset values (Chart 32).

…and also by unprecedented fiscal deficits and government borrowing
Another important point to remember is that, just as central banks are socializing risk in financial markets, governments are increasing their spending like never before during peacetime. Fiscal spending plans across developed economies are nothing short of breathtaking whether we look at them in dollar terms (Chart 34) or as a percentage of each nation's GDP (Chart 33). Of course, emerging economies do not have the domestic savings base to attempt such an extraordinary feat, but their central banks may opt to reduce DM sovereign bonds in favor of gold.

…and on our estimates investors are still underweight gold
Investment demand has correlated strongly with gold prices in recent years, and we expect precisely this group of buyers to drive gold prices higher (Chart 37). In other words, different levels of non-commercial demand are required to sustain different average price levels. Indeed, for gold to average $2,000/oz next year, purchases need to rise by 73% YoY (Chart 38). Given the current macro-economic backdrop, we believe this figure is likely to be exceeded.

We increase our average gold price forecasts from 2020 on…
We have been long-term gold bulls, maintaining our constructive forecast even through the recent volatility. That said, gold has now hit our average 4Q20 price forecast at $1,700/oz, Hence, we are marking-to-market expectations, while at the same time anticipating further upside, largely because central banks underwrite fiscal stimulus and financial markets through money printing, with fundamentals justifying a rally to $2,250/oz in 2021. Still, strong USD backdrop, reduced market volatility, and lower jewelry demand will likely remain headwinds to gold.

...and we also up our 18m gold target from $2000/oz to $3000/oz
Beyond the supply/demand fundamentals, financial repression is back at an extraordinary scale. Rates in the US and most G-10 economies will likely end up at or below zero for a very long period of time, just as central banks attempt to push inflation back above their targets. Beyond flow variables such as real rates, the USD or market risk, variables such as nominal GDP, central bank balance sheets, or official gold reserves will remain key determinants of gold prices. If central banks double their balance sheet as GDP contracts, gold prices will push higher (Chart 39). Thus, we increase our 18m gold target from $2,000 to $3,000/oz. When will gold start to catch steam? Our work shows that Google trends (Chart 40) could be an early real-time indicator that broader interest is picking up.
