Talking about talking about…
News
|
Posted 17/06/2021
|
6400
Last night’s “most important” US Fed meeting clearly delivered a surprise to the market with basically everything except the USD tanking on the more hawkish than expected outcome of FOMC meeting. Whilst, as all expected, they did not raise rates above the current 0.0-0.25% nor ease up on the $120b/month QE, a few members of the committee saw the first rate hikes move into the end of 2022 from 2023 in response to inflationary pressures and expectations of stronger growth off better than expected vaccination rates.
Gold and silver were the hardest hit, down 2.5% on the minutes being released and staying down whereas shares, down around 1% partly rebounded on chairman Powell stating (in reference to the so called dot plot below mapping FOMC member’s forecasts of interest rates):
“The dots should be taken with a big grain of salt,”
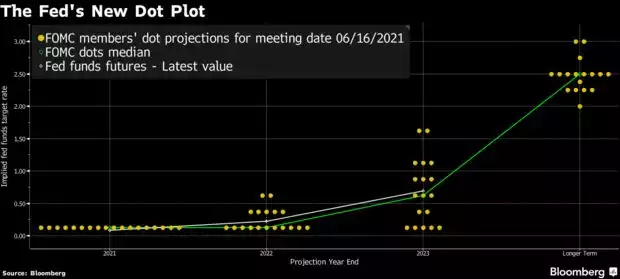
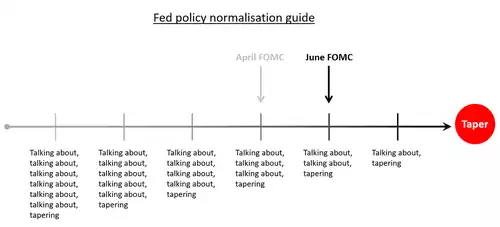
Clearly Powell is not one of the 2 dots/members above 0.5% in 2022 and is maintaining his personally more dovish stance. Indeed he was at lengths to talk down the changes saying (seriously) “You can think of this meeting as the talking-about-talking-about meeting, if you like,”
They have finally acknowledged inflation will be hotter than expected this year but maintain it returning solidly back to their target in 2022 and hence no need for action. From Bloomberg:
“The Fed marked up its inflation forecasts through the end of 2023. Officials see their preferred measure of price pressures rising 3.4% in 2021 compared with a March projection of 2.4%. The 2022 forecast rose to 2.1% from 2%, and the 2023 estimate was raised to 2.2% from 2.1%.”
Whilst all of that looks both very iterative and very far from a majority view of the committee, and despite the ‘grain of salt’ platitude, the market reaction was telling. It is now fearing a tapering of monetary stimulus is getting close. The following would be funny if not so sad…
So why did gold and silver fall? That is hard to answer but could be a multitude of reasons, principally around ‘taper’ expectations of higher interest rates. Certainly bonds got smacked last night and hence yields rose with the 10yr almost hitting 1.6% before settling at 1.56%. The USD, up nearly 1% also would have put pressure on precious metals and commodities alike. The Fed reiterating its belief inflation will settle back down in 2022 amid the prospect of higher rates later that year would also not have helped. However all these supposedly ‘technical’ reasons arguably miss the bigger point that the sharemarket gave some reminder of. Firstly, looking at the dot plot, even a median rate in 2022 of around 0.3% less 2.1% inflation is still very deep in negative real rate territory. Secondly, and this is surely the elephant in the room, we saw what happened last time they tried to taper into supposed economic strength in 2018… the sharemarket crashed. The junky is nowhere near ready for the juice to be taken away.
The chart below is prepared by Real Investment Advice and it should be at the front of every investors mind right now. Only now in hindsight and with the context of time can we see that the COVID crash was not a secular bear market in traditional sense. Yes it fell enough, but it rebounded almost immediately.
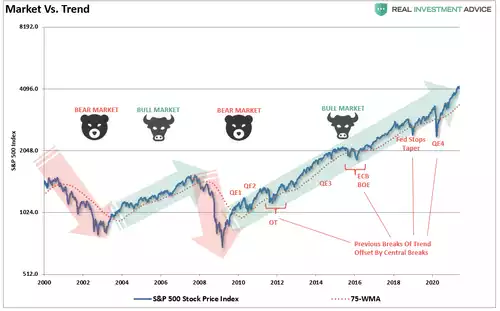
From author Lance Roberts:
““Tops are a process and bottoms are an event” – Doug Kass
During a bull market, prices trade above the long-term moving average. However, when the trend changes to a bear market, prices trade below that moving average.
The keyword is TREND.
The chart below which compares the market to the 75-week moving average. During “bullish trends,” the market tends to trade above the long-term moving average and below it during “bearish trends.”
Since 2009, there are four occasions where the long-term moving average was violated but did not lead to a longer-term change in the trend.
- The first was in 2011, as the U.S. was dealing with a potential debt-ceiling default and a downgrade of the U.S. debt rating. Fed Chairman Ben Bernanke started the second round of quantitative easing (QE), flooding the markets with liquidity.
- The second came in late-2015 and early-2016 as the Federal Reserve started lifting interest rates combined with the threat of Britain leaving the European Union (Brexit). Given the U.S. Federal Reserve had already committed to tightening monetary policy, the ECB stepped in with their version of QE.
- The third came at the end of 2018 as the Fed again tapered its balance sheet and hiked rates. The market decline quickly reversed the Fed’s stance.
- Finally, the “pandemic shut-down” of the economy led to a price reversion in the market. The Fed intervened with massive liquidity injections and the start of QE-4.
Each of these declines only gets classified as “corrections.” The market did not sustain the break of the long-term trend, valuations did not revert, and psychology remained bullish.”
“The chart below shows the deviation in the market price above and below the 75-week moving average. Historically, as prices approach 200-points above the long-term moving average, corrections ensued. Thus, the difference between a “bull market” and a “bear market” is when the deviations occur BELOW the long-term moving average consistently.
Since 2017, with the globally coordinated interventions of Central Banks, those deviations have started exceeding levels not seen previously. As of the end of May, the index was nearly 800 points above the long-term average or 4x the normal warning level.”
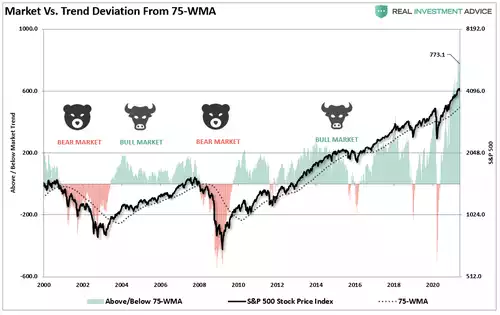
Four times the normal warning level…. To be fair, in percentage terms its closer to “only” twice….
The man made famous by The Big Short who shorted the US housing market before the GFC making billions, shared this “twice” view in a tweet a couple of days ago which says it all:
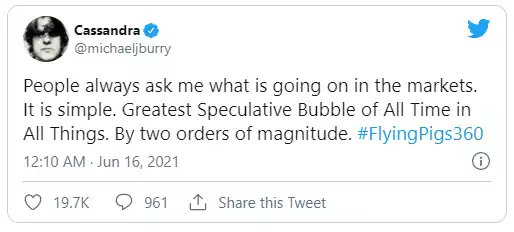
And so yes gold and silver took a hit last night on the news bite. However the broader setup in terms of negative real rates, and now with taper talk starting, the prospect of a serious market crash, simply cannot be ignored.