Fireworks On Horizon for Crypto Market
News
|
Posted 18/01/2022
|
6211
The Bitcoin market returned to a more docile state following a fear-fuelled last week. Investors and traders appear to be digesting the macro possibilities within this new inflationary regime markets we have entered, alongside an increasingly hawkish Federal Reserve. This change in tune has rattled the Bitcoin market in the short term and is at risk of taking control over its medium-term prospects.
Price opened last week at $41,718 US, briefly set new correction lows down to $39,821, before reclaiming the psychologically significant $40k level. The remainder of the week's price action was more buoyant, hitting a high of $44,252.
The significant onchain factors at the moment are:
- HODLer profits sitting at key historical levels, and the overall observable investor response
- Zoomed out supply dynamics and spending behaviour among short-term and long-term holders, and what it indicates about investor sentiment in the medium to long term
- Derivative activity, and what it can imply about shorter-term expectations towards Bitcoin price action
The Bitcoin price is currently trading down ~35% from the ATH set in November 2021. As the drawdown worsens, an increasingly significant volume of BTC supply has fallen into an unrealised loss. Approximately 5.7 million BTC are now underwater (~30% of the circulating supply).
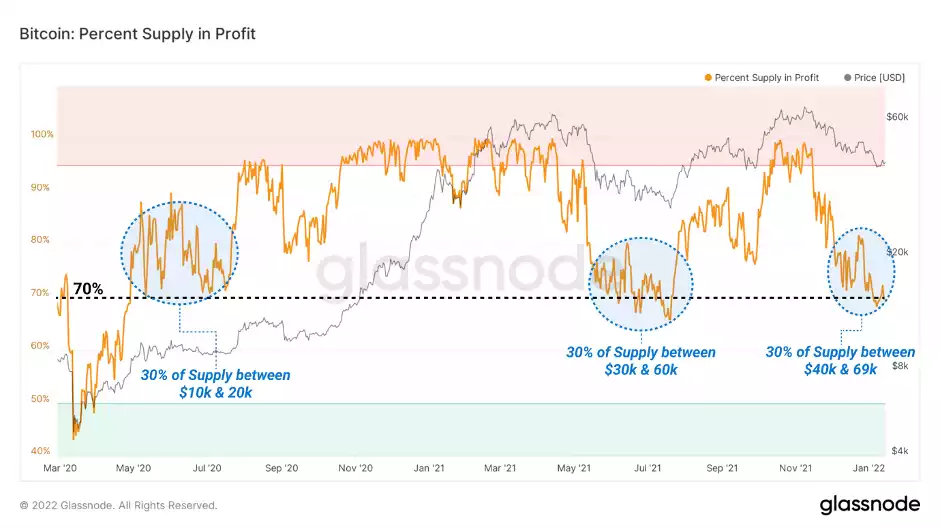
As the bears apply pressure to the in-profit cohort of holders, Bitcoin bulls are defending a historically significant level of the Percent of Supply in Profit metric. This magnitude of 'top heavy supply' was defended in two instances in the last few years:
- May 2020 - July 2020, the quiet recovery period following the extreme move downwards from Covid-related panic.
- May 2021 - July 2021, the choppy and accumulative period following a historical deleveraging event.
The reaction from this level will likely provide insight into the medium-term direction of the Bitcoin market. Further weakness may motivate these underwater sellers to finally capitulate, whereas a strong bullish impulse may offer much needed psychological relief, and put more coins back into an unrealised profit.
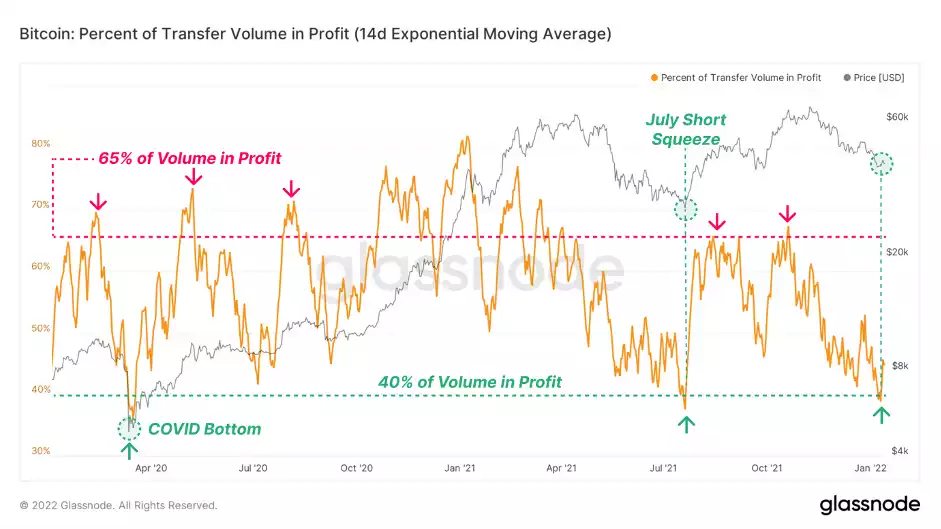
We can establish an appreciation of market-wide psychology by observing who is parting ways with their coins, and why and when these spends are taking place. The Percent of Transfer Volume in Profit chart displays the proportion of coins spent on-chain that were last moved at lower prices, as a gauge for macro fear and greed.
- Percent of Transfer Volume in Profit > 65% signals that a large number of coins are being spent in profit. This historically occurs during bullish impulses, as holders take advantage of market strength.
- Percent of Transfer Volume in Profit < 40% signals that on-chain volumes are dominated by coins acquired at higher prices. This historically occurs in market downtrends and especially capitulation events.
The sell-off this week saw less than 40% of spent volume in profit, reaching levels that historically coincide with capitulation events. Past instances at this level have preceded a bullish reversal and a period of general risk-on behaviour.
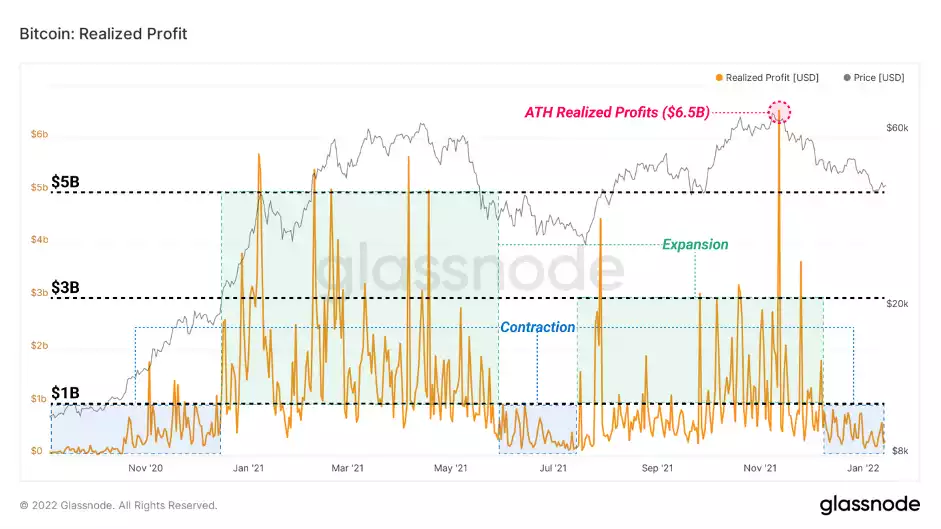
The low levels of profitable coin spending are also evident in the Realised Profit chart, which shows the profitability of BTC moved, on a USD basis. In-profit holders are displaying a notable unwillingness to spend coins, with consistent Realised Profit values below $1 Billion/day. In the face of tumultuous and unconvincing price action, this signals that this cohort of holders are patiently waiting for higher prices to spend their respective supply.
Climbing realised profits, especially above the $1 Billion level and accompanied by positive price performance, signals demand absorption of coins, and is a metric to watch in the coming weeks.
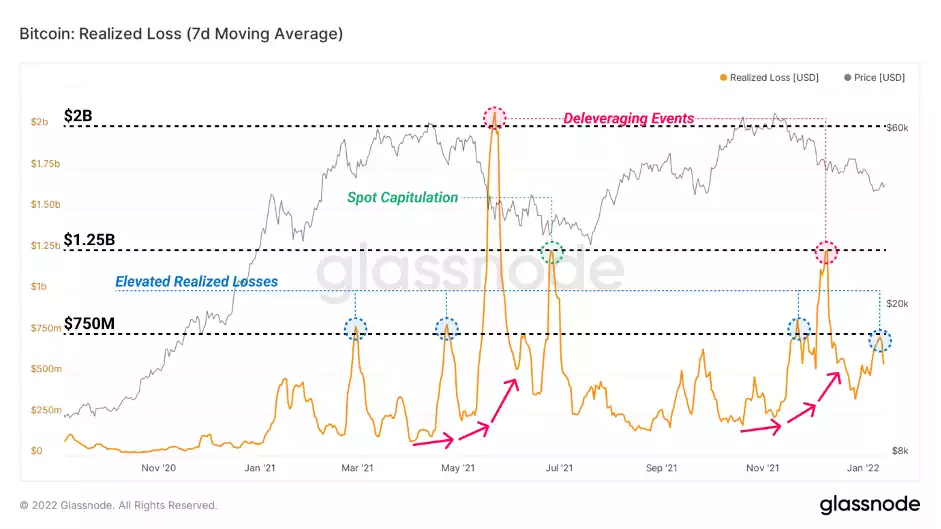
Meanwhile, Realised Losses remain elevated and trending higher, as underwater holders spend coins that were acquired near the market top through October and November.
On average, daily Realised Loss values are ~$750 Million/day, behaviour that is comparable to the May - July 2021 capitulation lows. The consistency of large loss realisation events is indicative of uneasiness within the market, however also reflects an estimate of demand inflows to absorb these spent coins.
Sustained periods of large realised loss does put the spotlight on the bulls to prove sufficient demand support. A macro decline in realised loss values would be a more encouraging signal for the bulls, as it provides an early indication of sell-side exhaustion.
We can also analyse the psychology and spending behaviour of both Short-Term Holders (STH) and Long-Term Holders (LTH) by looking at changes in their respective Realised Caps and supply dynamics.
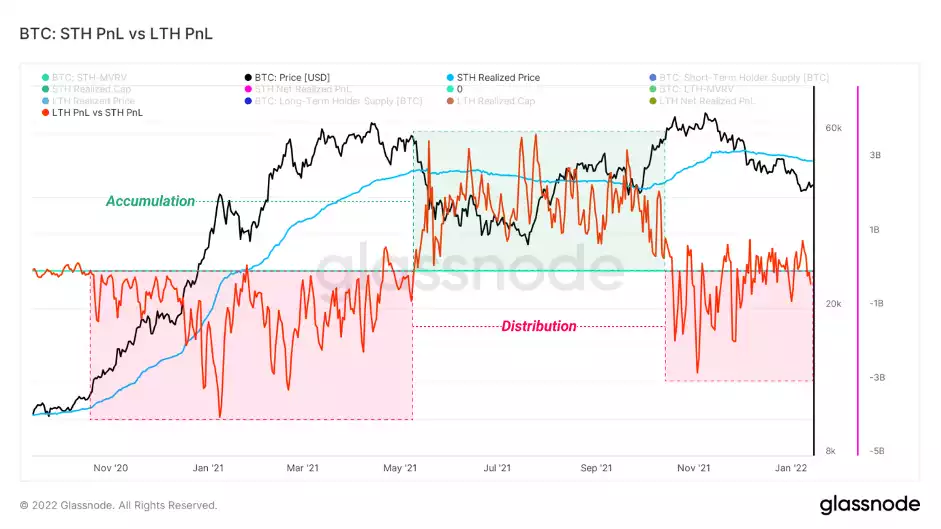
The following metric is calculated as the difference between the daily change of LTH and STH realised caps. Interpretation is as follows:
- Negative Values (red) signal that the STH Realised Cap is increasing more daily than the LTH Realised Cap. This occurs during bull runs when long term holders distribute supply into new holders.
- Positive Values (green) signal that the LTH Realised Cap is increasing more daily than the STH Realised Cap, which occurs during bearish accumulation markets as STH activity decreases, and unspent coins mature into the LTH cohort.
Values currently sit near zero with a general trend to the upside, indicative of a softening of distribution by LTHs, the market reaching a new equilibrium, and a potential reversal into accumulation. Note, however, that the process of establishing similar market equilibrium and possible macro bottoms has historically taken several months to resolve.
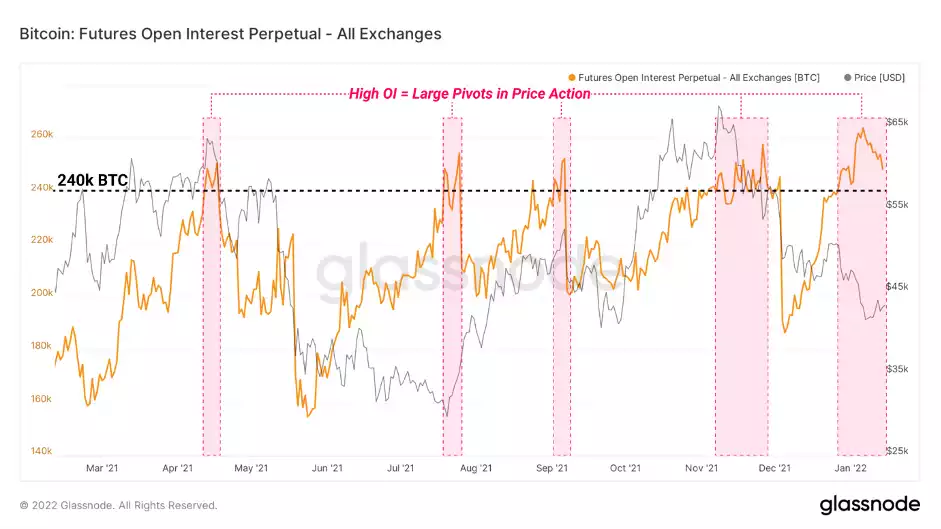
Amidst downwards pressure in Bitcoin holder profitability but yet favourable medium to long term supply dynamics, futures markets remain the driver for short term volatility with Perpetual Futures Open Interest at ~250k BTC - a historically elevated level.
Since April 2021, this has paired with large pivots in price action as the risk for a short or long squeeze increases, resolved in market-wide deleveraging events.
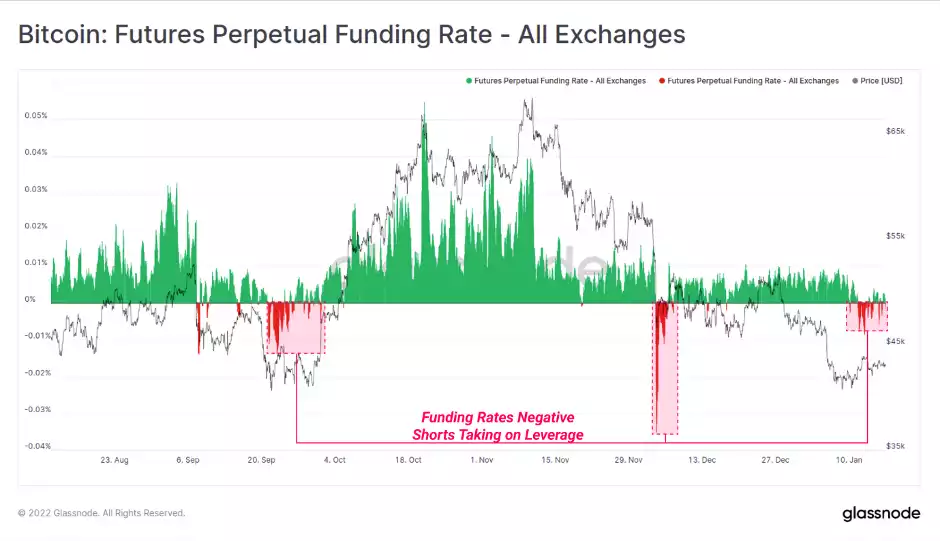
Alongside high open interest, funding rates this week moved into negative territory, indicating that shorts were increasingly hungry for leverage. As perpetual swap markets were pushed below spot prices, it does add further bias towards a potential oversupply of short positions close to the current price.
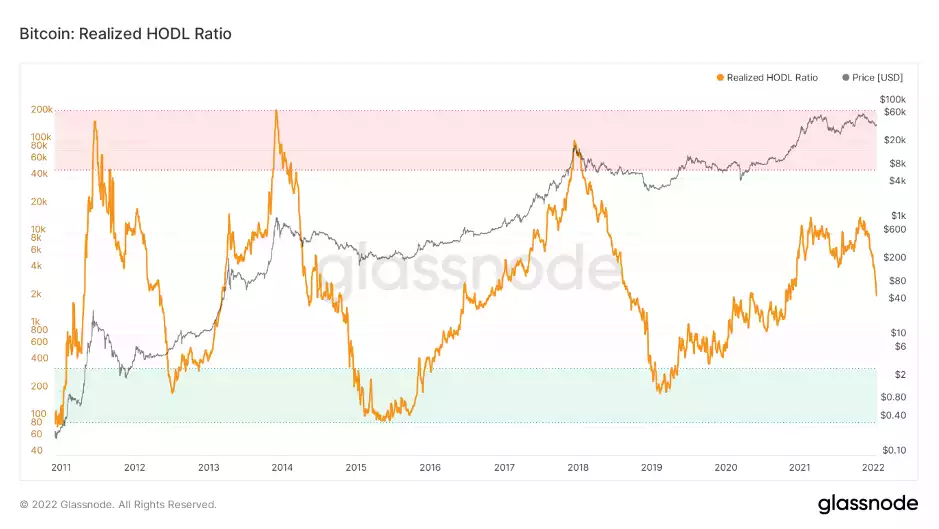
The Realised HODL Ratio is a market indicator that uses a ratio of the Realised Cap HODL Waves. In particular, the RHODL Ratio takes the ratio between the 1 week and the 1-2 years RCap HODL bands. In addition, it accounts for increased supply by weighting the ratio by the total market age. A high ratio is an indication of an overheated market and can be used to time cycle tops. Currently, this metric is showing that the market is within the consolidation range – we have neither seen a blow-off top nor a capitulation buying opportunity. The more this metric continues to fall, the better the buying opportunity becomes. However, as shown in the chart below, there’s still a lot of room to move to the downside.
In summary, there is evidence that the market is reaching some form of price and momentum equilibrium, within what is a broader bearish market structure. Bitcoin bears certainly have the upper hand, however modest bullish divergences are appearing across several on-chain metrics and indicators. Coupled with elevated future open interest, and a bias that appears to be a short heavy market, a risk of a deleveraging to the upside remains on the table.