Fed hits $8trillion – UST yields Biggest Yearly Drop
News
|
Posted 14/06/2021
|
6370
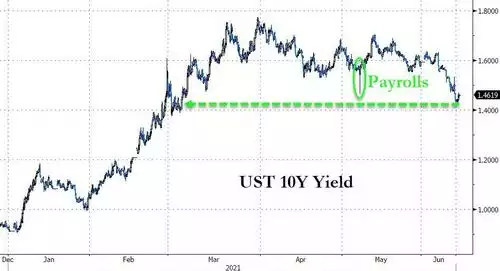
Despite raging inflation prints last week, bond yields plummeted on Friday night making the cumulative drop in 10 year Treasury yields last week the biggest in a year. The market is screaming it thinks this inflation is indeed ‘transitory’ or at the very least that the Fed will not ease or taper even if it is.
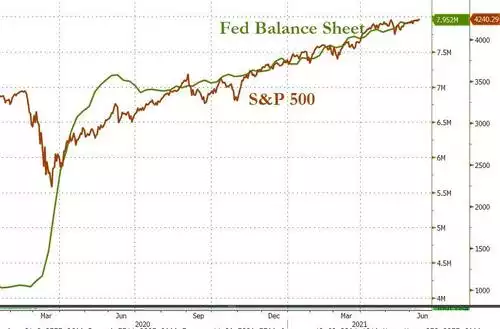
It could also well be the gravity of the trap the Fed is in hit home on the news that last week we saw the Fed’s balance sheet hit $8 trillion! Remember the amazement when it hit $4.5 trillion after QE3. And critically, remember how it crashed the market at the end of 2018 when it tapered it back to ‘just’ $4 trillion. Well it’s now double that and both government and private debt massively higher too. The market is basically saying that regardless of whether this inflation is transitory or not, the Fed is trapped in an easy money death spiral.
And so, as we discussed on Friday, negative rates are firmly here to stay and that is great news for gold. The following article from Mish’s Mike Shedlock is a great analysis of this correlation.
“Real Interest Rates Suggest It's A Good Time To Buy And Hold Gold
Let's investigate the relationship between real interest rates and the price of gold.
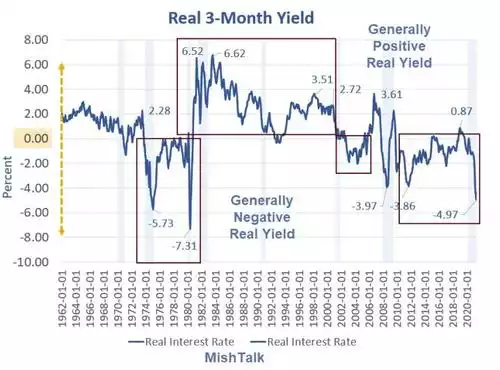
Real means inflation adjusted.
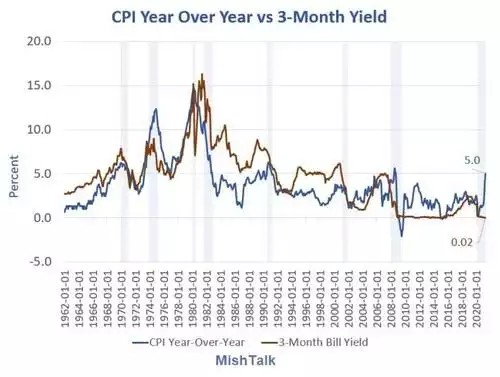
I calculated the real interest rate by subtracting year-over-year CPI from the current 3-month T-bill yield.
One could also use the Fed Funds Rate or 1-month T-Bill rate as the yields are all about the same.
The following chart puts the negative interest rate theory to the test,
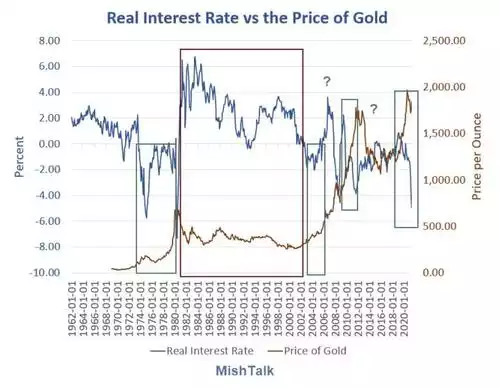
The chart above shows the monthly gold close, not monthly highs. That explains why the 1980 top does not show.
Synopsis
Gold took off in the stagflation years then collapsed from $850 to $250 an ounce with inflation every step of the way.
Note that between 1980 and 2000, the Fed kept real interest rates in positive territory except for one minor and brief moment.
In response to the DotCom bust, housing bust, and Covid-19 recessions, rates have been generally negative.
The first question mark around 2006, gold kept rising despite positive rates, but that is if one believes the CPI. If one factors in housing, real rates were indeed quite negative.
One might also argue the chart reflects anticipation of the financial stress of a housing collapse.
The second question mark pertains to ECB president Mario Draghi's statement "We will do whatever it takes to save the Euro and believe me, it will be enough".
Simultaneously, in the US, expectations there was endless speculation about Fed normalization, ending QE, Tapering, hiking rates, etc.
People actually believed the Fed would do all those things and that made for a rough spell as gold fell from over $1900 an ounce to around $1100.
Timing vs Magnitude
Real interest rates suggest nothing about magnitude of the move. Rather, it's a directional indicator.
It goes along with what I have stated previously about faith in central banks.
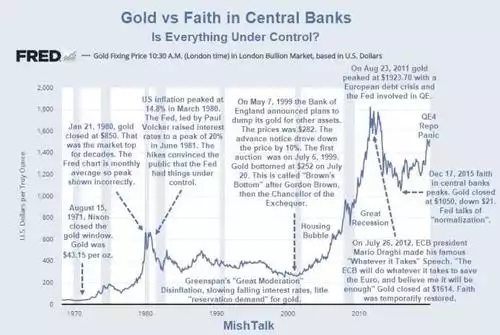
When the Fed has positive real rates, gold tends to do poorly.
Real interest rates approached 7% in early 1980's. If that happened now, the 3-month T-bill would yield an astonishing 12%.
How likely is that?”