End of the Unloved Bull Market
News
|
Posted 18/09/2017
|
7111
Goldman Sachs are one of the biggest and most respected investment houses in the world. They have just undertaken a review of the current US sharemarket bull run and concluded their clients should be worried.
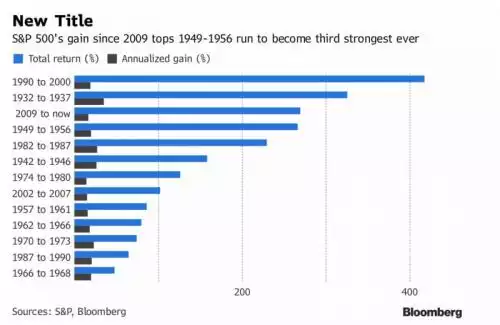
This bull run has just become the 3rd longest in history per the graph below:
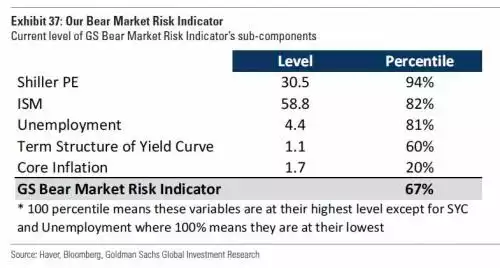
Goldmans apply economic ‘science’ to their analysis by examining no less than 40 different variables in what triggers a bear market. Of the 40 examined they then condensed this to 5 dominant factors – Valuation (using the pre-eminent Shiller PE metric), ISM (to measure growth momentum), bond yield curves (gauging safe haven investment) , and finally unemployment. And the result… a 2/3 chance of a bear market being imminent.
One of the most telling charts for us however is the following one. We often talk about how this market is more to do with monetary stimulus than fundamentals – the “central bank bubble”. That a good look at all the asset bubbles below and then look at the various gauges of the real economy….
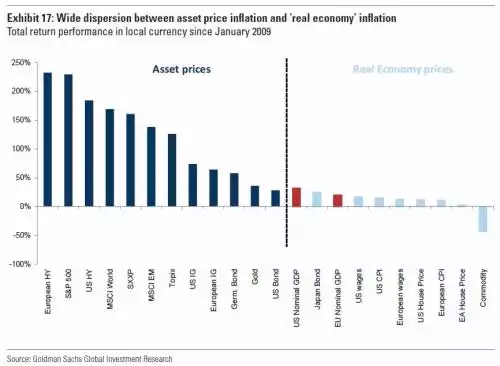
That one graph explains so much of what is wrong in the world today. Not only does it highlight the monetary stimulus effect, it highlights how ‘Main St’ has been left behind by ‘Wall St’, and the social discord that has created. It also explains why this bull market is often considered the ‘most unloved’. It just doesn’t feel ‘right’. Over to Goldmans:
“Since the 2007 financial crisis, fears of recession and secondary bear markets and corrections have never been far away; for much of the past few years investors have struggled to shake off the shadow of the global financial crisis and the great recession. This has meant that the current bull market is likely the least ‘loved’ and in many ways the most unusual in history. The current upswing in equity prices is already among the longest and strongest in history, and many investors are clearly wondering how much longer it can last. This reflects both the very unusual nature of the economic and stock market recovery of recent years (plagued by weak economic and profit growth and persistent fears relating to the financial system), as well as the unprecedented role played by policy adjustments (and QE) adopted to soften its impact.”
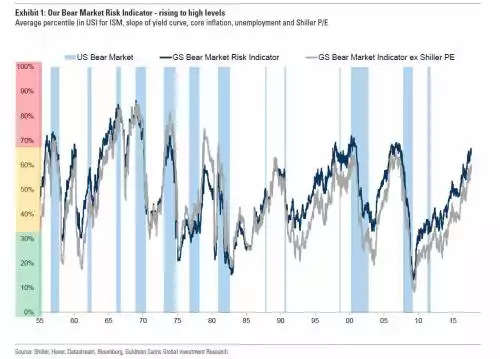
To summarise all of this in one historic chart:
Now going back to that very first chart and you could well see this bull market continue on into 2019 if it were to outlast the 1990-2000 bull run. On some level you might even expect that given the unprecedented amount of stimulus applied to it since the GFC. There are 3 things to consider however. Firstly there is growing talk of the stimulus being unwound. Indeed this Wednesday the US Fed is widely expected to start it’s deleveraging of its massive QE amassed balance sheet. Secondly, logic would indicate the bigger the rise (especially when ‘artificial’ in nature) the bigger the potential fall. The GFC was because of too much debt and we’ve added over 50% more in the 8 years since. That 1990-2000 record we are chasing saw 80% declines on the NASDAQ at its end. Third and finally, Goldman Sachs just assigned a 2 in 3 chance of it happening soon. Feeling lucky?