Dr Copper Signals Gold Rally
News
|
Posted 21/12/2020
|
7479
There are a number of factors aligning on why now might be a good (re-)entry point for gold. The 4 month correction since gold reached all time highs in August has, as it did in the big liquidity squeeze in March, found support at the 50 week moving average (WMA), maintaining gold’s bull run since it passed through the 50 WMA at the beginning of 2019 as can be seen in the chart below:
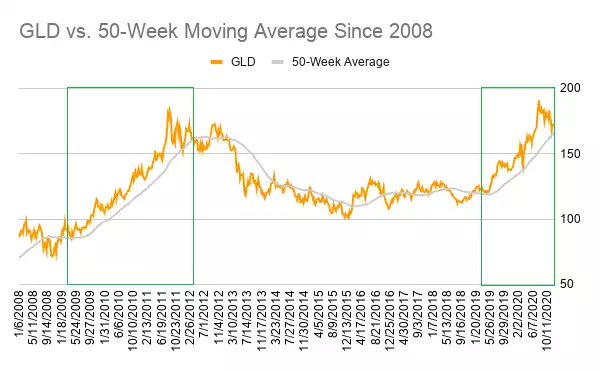
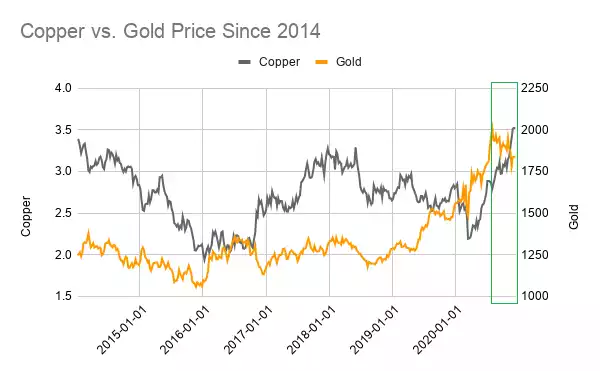
WingCapital, the authors of the chart above see this and 2 other points as constructive for the gold price. They look too at the relationship with copper, or Dr Copper as many economists refer to it as an historically important indicator. Copper has surged to its highest price since 2014 on reflation expectations whilst gold has declined on the same:
This move has seen a break through of the 50 WMA for the copper to gold ratio just as it did in late 2009 during the GFC as you can see in the chart below:
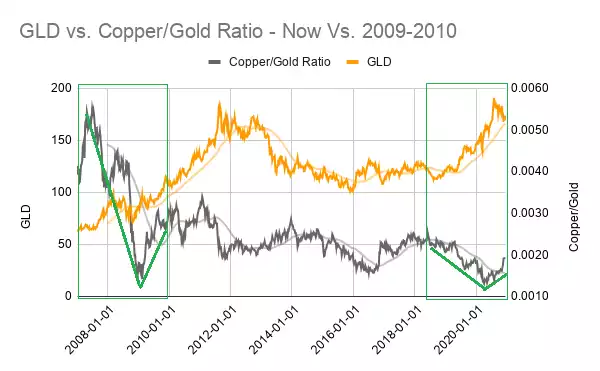
From their report: “A more crucial observation is that the multi-year bull market in gold started in late 2008 right before the recovery rally in copper/gold ratio commenced, and only ended in 2011 after gold more than doubled its price. Also, notice the 50-WMA continued to serve as a launchpad to higher highs over the course of the bull run.
In short, the historical analysis suggests that the bull market in gold does not necessarily end when a cyclical recovery is underway, and that the recent pullback is no more than a healthy retracement towards its long-term moving average.”
Their second indicator is one we have written to frequently and that is of course all the debt and its drag on GDP.
“Further supporting a breakout year ahead in gold is the fact that the federal deficit vs. GDP ratio is set to balloon above 2008 GFC highs of 10% and even above the WWII record highs of ~30%. Per Axios:
“The federal budget deficit will reach $3.3 trillion in the fiscal year ending this month - more than triple the 2019 shortfall, the nonpartisan Congressional Budget Office (CBO) projected on Wednesday.
Why it matters: That would be 16% of GDP, the largest amount since the end of World War II in 1945. The national debt is projected to exceed 100% of GDP in 2021 and rise to 107% in 2023 - "the highest in the nation's history," the CBO notes.””
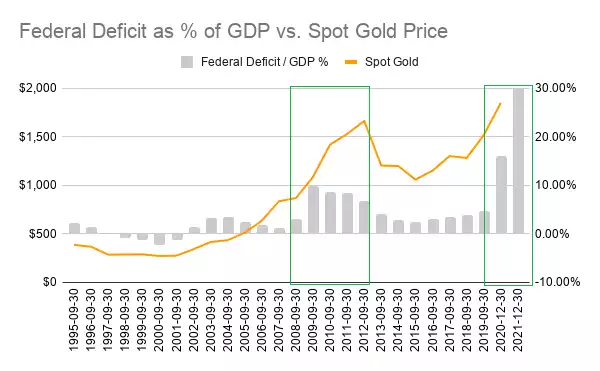
“This time around, the unprecedented amount of fiscal measures enacted to combat the economic fallout from the coronavirus pandemic has already exceeded that from the last crisis with no signs of slowing down. With the deficit/GDP ratio expected to continue expanding for years to come, we anticipate gold to embark on a multi-year breakout similar to that from 2010. On that note, we reiterate our long-term price target of $3000, which we expect to be reached by 2022.”
Coincidentally, and to digress momentarily to address the ‘bitcoin is replacing gold’ rubbish, Goldman Sachs came out late last week maintaining they see no “evidence that Bitcoin’s rally is cannibalizing gold's bull market and believe the two can coexist.” in part using copper again as an indicator. The chart below shows the tight correlation between copper and bitcoin.
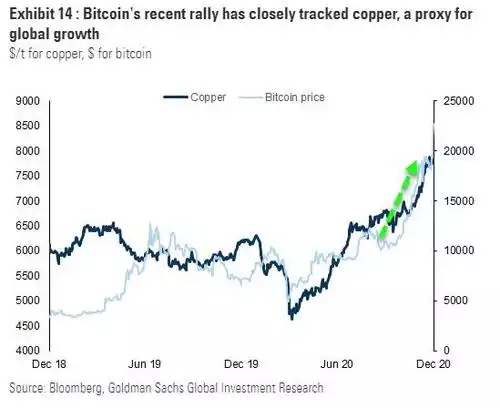
From Goldman: “In our view, bitcoin is the retail reflation trade while gold is a defensive asset with long-term real capital preservation. In addition, gold's recent sell off was more closely aligned to a vaccine-driven risk-on rotation, rather than an abandonment of gold as a hedge against debasement.”
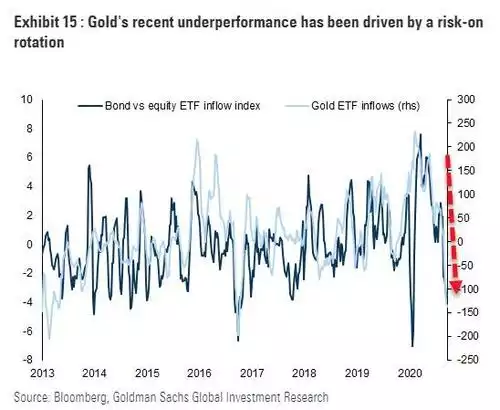
“Such aggressive rotation historically doesn’t last too long as investors quickly re-balance their portfolios. Therefore, in early 2021 we expect gold ETFs to rebuild.
Given the rising inflation expectations, weakening dollar and lofty valuations in some risky assets, demand for safe-haven inflation hedges should remain supported next year, continuing to push gold higher towards our $2300/toz target.”