Crypto Market Strong at Highs
News
|
Posted 12/10/2021
|
5650
The Bitcoin market has continued to show strength this week, with prices trading within a tight consolidation range, with a low at $53,657, and a high of $56,250. Following an impressive rally from the September lows, the market has managed to hold onto the gains whilst on-chain activity has commenced a welcome climb higher.
When asked to explain these latest price movements, analysts pointed to a range of factors, including speculation surrounding the potential approval of a futures-based bitcoin exchange-traded fund (ETF) and strong retail accumulation.
There is no doubt that investors’ sentiment is well fuelled as October marks the deadline when the SEC will have to decide as to either approve, reject or delay ETF’s. Buyups amongst investors cutting across both retail and institutional sectors has pushed the price of BTC to its highest level since 12 May of this year. The SEC is known for its conservative approach to Bitcoin ETF’s, however, the current anticipation is based on the fact that the majority of the filings are based on Bitcoin Futures. Any opening up of the market to the retail and institutional flow from the US market will add to significant buying pressure to the underlying markets and may be driving speculation.
The market is fundamentally strong and ready for prices increases, as seen in the on-chain data. The first week of October has experienced a long-awaited boost in the network activity, increasing the probability that new demand is beginning to enter in the fourth quarter of 2021.
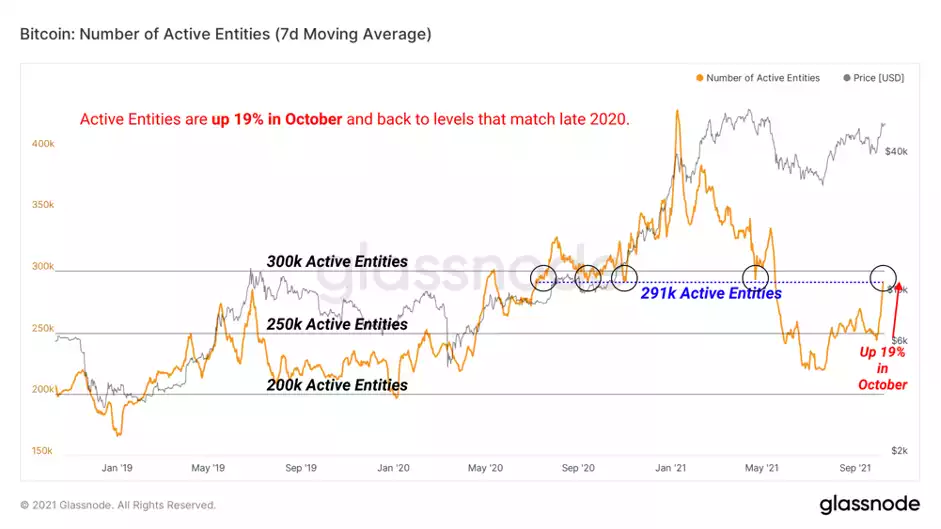
Active Entities, the count of individual participants on-chain each day, has grown 19% this week, reaching around 291k active entities per day. This value is on par with counts from late 2020 at the beginning of the last bull run. More active market participants have historically correlated with growing interest in the asset during early-stage bull markets.
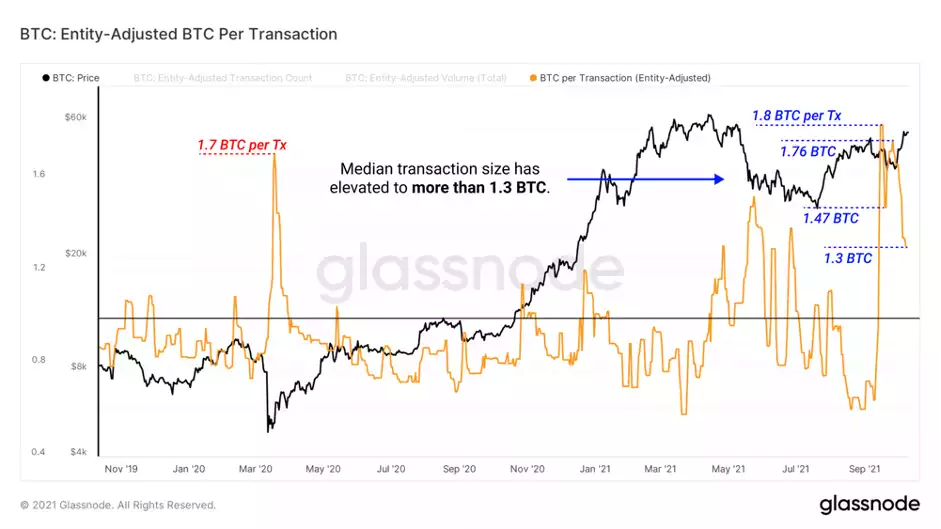
Along with an elevated number of market participants, the typical coin value of transactions has also increased. Since mid-September, the median transaction size has risen to over 1.3 BTC. The last time the Bitcoin network saw a median transaction size above 1.6 BTC was March 2020 during the global liquidity crash.
Increased typical transaction size is not synonymous with price appreciation, but indicative of larger and even institutional sized capital flows present on-chain. Generally speaking, periods near the end of bear markets are when smart money starts to accumulate in size. These periods are often characterised by lower (but rising) on-chain activity and increasingly large transaction sizes.
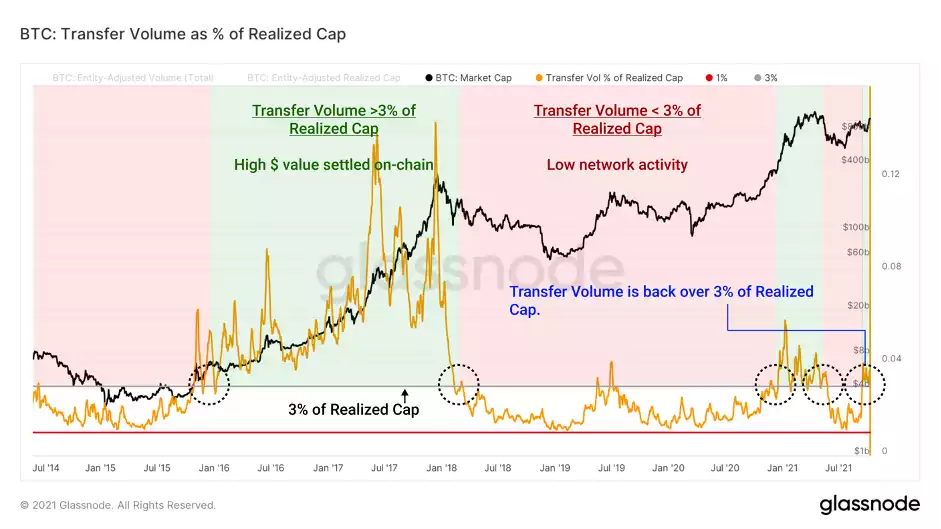
The dollar value of volume moving on-chain has also increased to meaningful levels. By viewing Transfer Volume (USD) as a percentage of the Realised Cap, we can directly compare network activity to the value 'stored' in the asset. The chart below presents 'Realised Velocity', calculated as a ratio between USD denominated on-chain transaction volume, and the Realised Cap. This gives a sense of the level of demand volume relative to the value of the coin supply valued at the time it was last spent on-chain.
- Transfer Volume greater than 3% of Realised Cap typically marks the beginning of a bullish market phase as network utility increases relative to realised valuation.
- Transfer Volume less than 3% of Realised Cap indicates a more bearish phase where network utility is low or declining relative to the realised valuation.
Transfer Volume has once again broken above the 3% threshold suggesting growing demand for on-chain settlement of value. This is a very bullish development.
There is a good chance that Bitcoin will experience major growth throughout the remainder of 2021. If/when the price breaches the all-time highs, it enters the price discovery phase which often proves to be exponential for the crypto market. It’s certainly an exciting time to be watching the crypto market