“Most Offensive Levels In History”
News
|
Posted 08/11/2017
|
7676
Dr John Hussman’s November 2017 newsletter presents investors with some serious warnings about the current US sharemarket. He starts with a reminder of his warning issued on 7 March 2000:
“Over time, price/revenue ratios come back in line. Currently, that would require an 83% plunge in tech stocks (recall the 1969-70 tech massacre). If you understand values and market history, you know we’re not joking.”
What immediately ensued was the dot com crash that saw, spookily after the above quote, 83% losses in the NASDAQ100 tech shares. However, as we’ve written recently, the dot com bubble and crash was very heavily weighted to tech shares (general shares lost 30-50%) whereas this ‘everything bubble’ sees a much broader range of sky high valuations. Indeed if you ‘bought’ the whole S&P500 now, his analysis predicts negative returns, including dividends, for the next 10-12 years…(and before you dismiss such a claim, try and ignore the correlation of nearly 100 years of date illustrated below).
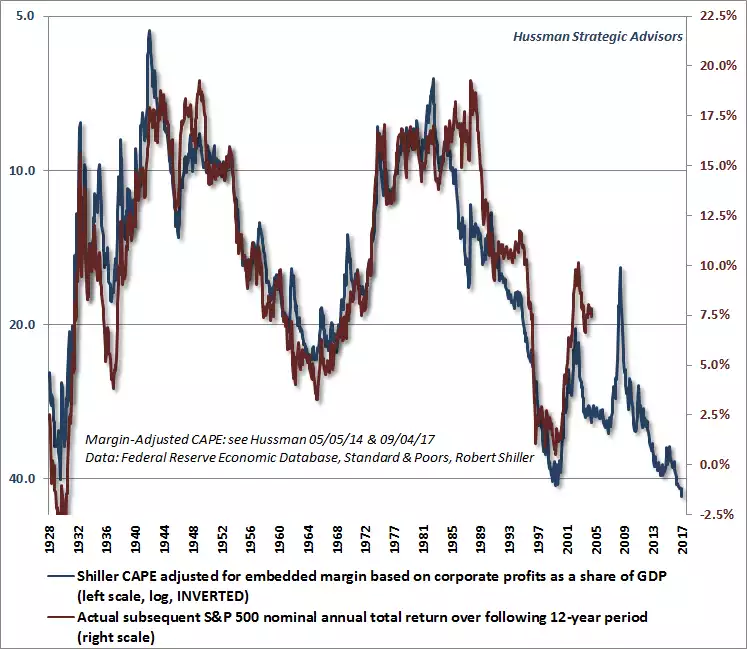
“Based on the valuation measures we’ve found to be most reliably correlated with actual subsequent market returns in market cycles across history, including those of recent decades, we presently expect the average annual total return of the S&P 500 over the coming 10-12 year horizon to be negative. Market valuations, on these measures, presently approach or exceed the 1929 and 2000 extremes, placing U.S. equity market valuations at the most offensive levels in history. Indeed, with median valuations on these measures now more than 2.7 times their historical norms, there is strong reason to expect a market loss on the order of -63% over the completion of the current market cycle; a decline that would not even bring valuations below their historical norms (which we’ve typically seen by the completion of nearly every market cycle outside of the 2002 low).”
So what does ‘2.7 times historical norms’ look like?
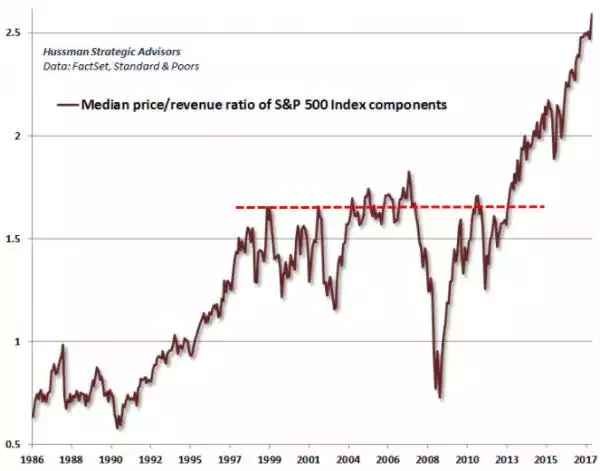
“….it’s important to reiterate that unlike the 2000 valuation extreme, which was largely focused on a subset of extremely overvalued technology stocks, the current market extreme is the broadest episode of extreme equity market overvaluation in history. The chart below shows the median price/revenue ratio of S&P 500 component stocks, which set yet another record high in the week ended November 3, 2017, and now stands more than 50% above the 2000 extreme.”
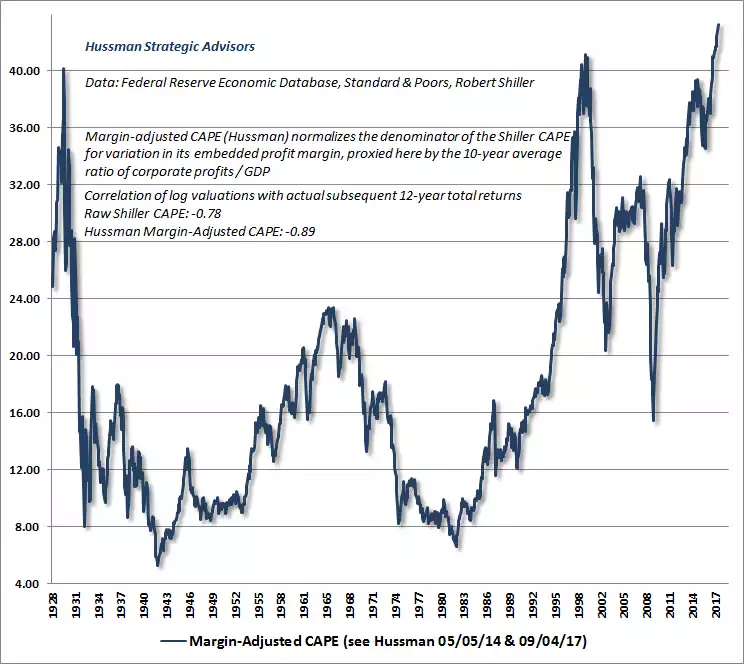
And looking back even further in history and adjusting the Shiller CAPE to Hussman’s ‘Margin-Adjusted CAPE’, normalising the traditional measure on earnings/GDP you get “On this measure, market valuations are now more extreme than at any point in history, including the 1929 and 2000 market highs.”
We must point out that despite his eerily close predictions of the last 2 crashes he was caught out on this post GFC run. As he put it:
“The more investors speculate, the more they tend to become impressed by the outcomes of their own speculation, which temporarily results in self-reinforcing bubbles. Prior market cycles offered extremely useful signals before that self-reinforcing process collapsed. This cycle was different, and our reliance on those same signals resulted in quite a bit of pain.”
What he missed, as did many, was the impact of the central bank stimulus to inflate markets well beyond previous fundamentals. He missed out on substantial gains in this current bull market, and hence the ‘pain’ reference.
That said he has adapted his modelling, deconstructed the impacts of zero interest rates and stimulus and concludes that whilst there could well be a little left in this market but the downside will wipe that out entirely. We remind you of our Financial Maths 101 article earlier this week. He then describes where we are and where we are likely heading:
“It’s clear from market internals that investors again have the speculative bit in their teeth. What’s important, however, is to distinguish near-term speculative outcomes from longer-term investment outcomes. If history is any guide, the first leg down from the current speculative blowoff is likely to be abrupt and rather vertical. Investors will be tempted to buy into that decline, and may very well be rewarded for it over the shorter-run. The problem is that while investors are reluctant to sell into strength here, they may also have no tolerance for selling into a market loss once internals break down. Instead, they will likely pass up their opportunity to reduce exposure to market losses even after market internals deteriorate clearly. After that, the intermittent hope from fast, furious (but ultimately failing) rallies will likely encourage them to hold on all the way into a deep market collapse. That’s how severe market declines unfold.”