Buckle Up for the Fortnight Ahead
News
|
Posted 17/06/2019
|
6396
If you look at the two biggest influences on global markets of late, they are the Fed’s rates policy and the US China Trade war. This week the Fed meet for their June FOMC meeting and next week we have the G20 meeting between Trump and Xi.
The market is almost fully pricing no change by the Fed this month (but expecting a cut in July) and lets face it, has no idea what will happen at the G20.
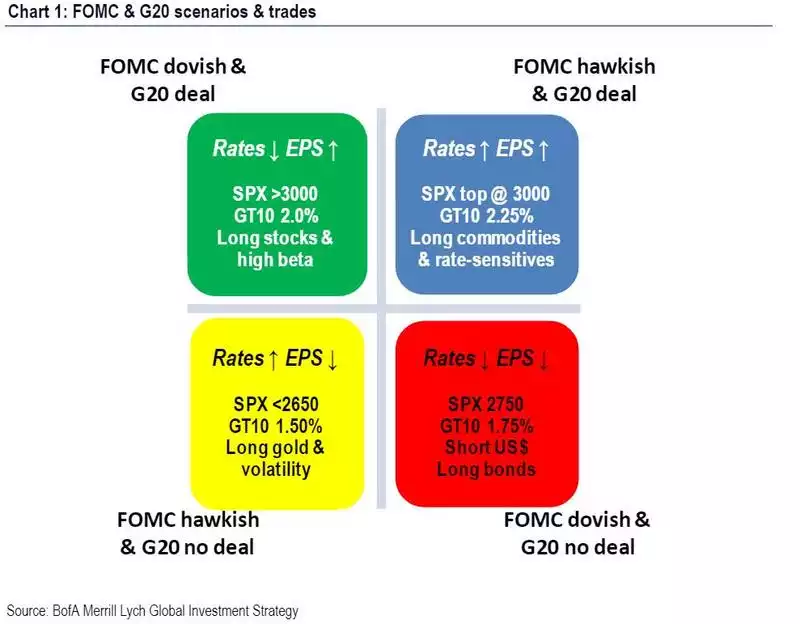
Late last week Bank of America Merrill Lynch’s CIO presented a 2 x 2 matrix of possible outcomes and the effect of each on the market.

When talking ‘dovish’ for the Fed he is more referring to ‘easing’ language in the accompanying statement rather than an actual cut. Likewise a ‘hawkish’ outcome would be statement language holding firm on not cutting rates or unwinding their QE amassed bonds.
As you can see from the outcome matrix above they are recommending trades off each scenario. Put simply, should the Fed appear ready to ease and a tangible deal is struck between the US and China (green box), they expect the S&P500 to surge over 3000 points (from its current 2887) and bonds to bid mildly and the yield drop to 2% (currently 2.09%). One has to really question how long that share rally would last given each previous recession was preceded by a cut to rates after a tightening cycle into weakness.
Should we get a deal but the Fed stay firm (blue box) they expect a short lived trip to 3000 for the S&P500 on the news but correct on no more ‘stimulus’ from the Fed, bonds falling (and hence yield jumping to 2.25%) and, importantly for silver potentially, commodities being the winner.
Should the Fed indicate they are close to cutting rates but still no deal (red box) the S&P500 sinks to 2750 and, importantly (and positive) for gold, the USD drops along with bond yields.
Finally the ‘worst/worst’ case for markets is both a hawkish Fed and no G20 deal (yellow box). In other words more pressure on US companies (and hence dropping Earnings Per Share (EPS)), and no Fed-to-the-rescue rate drop in sight. That of course would see the sharemarket outright tank, volatility surge and along with both, gold surge too.
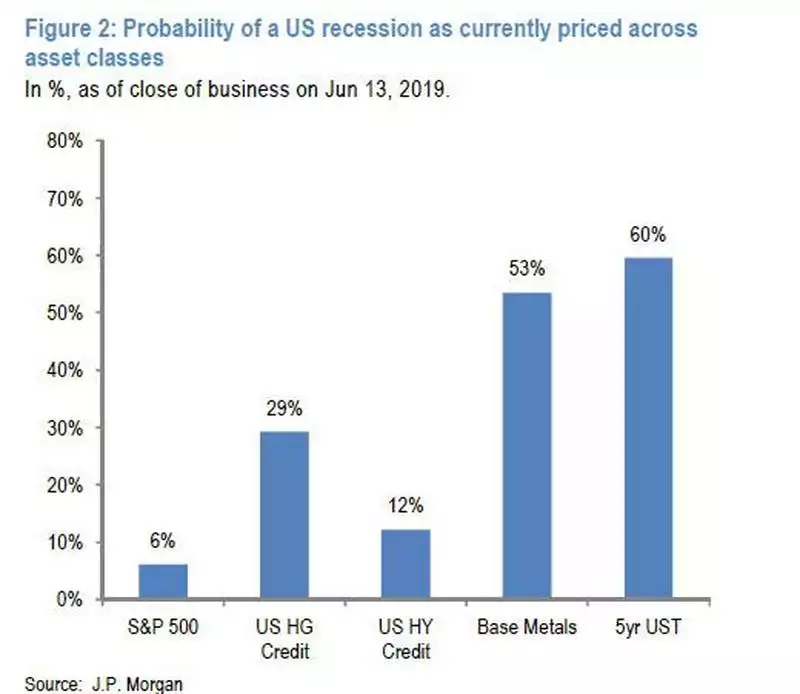
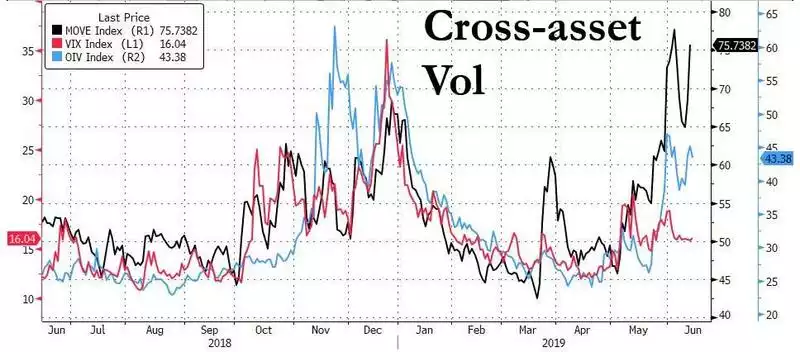
That volatility piece is really very intriguing at the moment. The sharemarket, despite all the data before it right now is just not showing any meaningful volatility (via VIX). Indeed it is down around levels seen before the market crash late last year. JP Morgan produced this chart over the weekend showing the extent to which each market is pricing in a recession. As we’ve written about previously we have this huge disconnect between bonds and the sharemarket and this chart highlights this beautifully as well:

Check out the disconnect playing out right now in terms of the relative volatility between bonds (MOVE), oil (OIV) and shares (VIX).

One thing we can be absolutely sure about BofAML’s analysis above is that neither they nor you really know what will happen. The above does not factor in the escalating Iran tensions, the longevity of any ‘deal’ struck between China and the US nor any of the other Black Swans currently circling. It’s all about balance and ensuring you are protected in any event.