The “Everything Bubble”
News
|
Posted 30/09/2016
|
6376
The Felder Report produced some very insightful graphs and observations over the weekend that capture the essence of the problem before markets. Taking issue with Janet Yellen’s (US Fed Chair) recent statement when defending leaving rates on hold…
“I would not say that asset valuations are out of line with historical norms.”
…he went on to highlight that this is exactly what is happening.
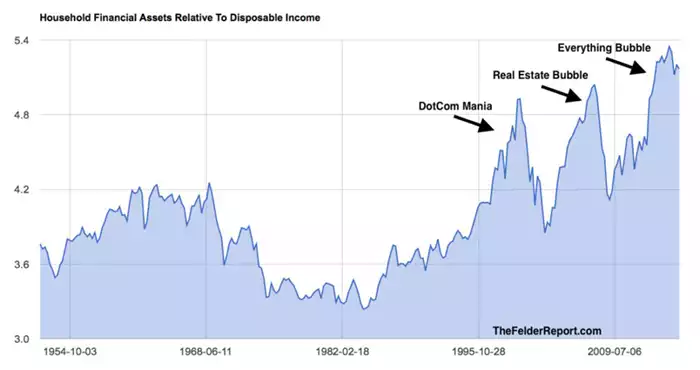
But rather than the more simplistic measure, Felder produces the following graph which looks at household financial assets versus disposable personal income (DPI).
But if you think that looks scary, in reality it is far far worse. The denominator in that equation, DPI, since the GFC has seen a massive increase in what is called “transfer payments”. Transfer Payments are payments made or income received in which no goods or services are being paid for, such as a benefit payment or subsidy. In other words it’s the likes of social welfare where that is funded by taxing others or deficit debt robbing future generations, and thus is not newly produced income, services or goods. For those mathematically challenged, if you removed the transfer payments from DPI that graph above shoots up.
Felder spells this out in real terms pointing out that since 2007 household financial assets have increase from $53trillion to $72 trillion, a 36% rise or around 4% annually. DPI without transfer payments (‘real personal income’) rose just 1.2%.
That this is occurring in unison with weak real economic growth (recall the Fed just downgraded US GDP again to 1.9% and global trade plunging) and a protracted period of declining earnings makes for a very scary cocktail.
Again don’t get caught up thinking this is just a US problem. This is a global phenomenon and Aussies have arguably gone harder than most racking up ‘world’s worst’ personal debt amid stagnant wage growth and our largest property market just being named the 4th riskiest in the world.
So the assets on top of that equation are increasing largely on multiples expansions (over valuation) whilst the income below it is overstated in real terms. That looks very much like a bubble sorry Janet…