BTC’s Overdue Pullback – What Does The Future Hold?
News
|
Posted 14/09/2021
|
5592
The Bitcoin market experienced a high volatility sell-off early last week, with prices initially breaking up to a new local high of $52,849 US, before selling down to a low of $44,196. What appeared to be the main driver on the sell-side, was a flush-out of excessive leverage in futures markets.
Meanwhile, in spot and on-chain markets, the historically significant trend of investor accumulation and long-term holding remains well and truly intact. Despite a 50%+ sell-off experienced in May, a strong rally from the $29k US lows, and now another sharp sell-off this week, HODLers appear unphased.
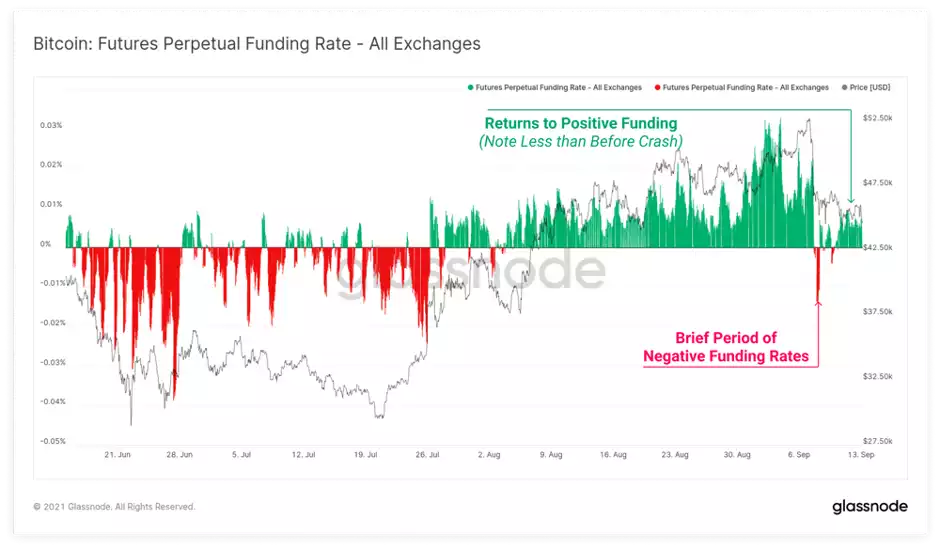
After a very brief period of negative funding rates during the sell-off, perpetual markets have returned to a slightly positive funding rate suggesting that traders are still expecting upside price momentum. However, the magnitude of funding is much lower than it was before the crash, suggesting that at least a partial deleveraging has occurred.

“The crypto market showed signs of stability entering the new week. Most crypto traders and investors would be looking forward to putting the volatility of the previous week behind them. The largest cryptocurrency by market capitalisation, Bitcoin found support near the $45,500 mark. The largest Altcoin, Ether showed strong character above $3400 US. This new week would be crucial for the two heavyweights in crypto. The global crypto market cap stood at $2.12 trillion, a marginal increase of 0.94% over the past 24 hours. The trading volumes dropped massively as traders remained watchful over the weekend. Bitcoin dominance also took a marginal dip, although the overall market capitalisation increased riding on the back of an Altcoin rally," Edul Patel, CEO and Co-founder, Mudrex- A Global Crypto Trading Platform said.
The overall crypto market cap recently touched $2.4 trillion since its upward trend from the 3rd week of July in a likely rising channel pattern. We also saw a trend reversal in the last few days which could be attributed to the recent market volatility due to Bitcoin adoption in El Salvador coupled with a 2% dip in the US markets. The recent correction saw some selling in high volumes. Bitcoin is also trading below its 200-day Moving average.
Other on-chain indicators are telling much of the same story. The Bitcoin mining market continues to recover after half of the hash-power came offline during the Great Migration out of China. The 14-day median hash-rate has recovered to 128 EH/s, which is approximately 29% below the all-time-high, and reflects a 42% recovery from the July lows. The increase in hash rate is likely a combination of previously obsolete hardware finding a second lease on life, and miners in China successfully relocating, re-establishing or re-homing their hardware and operations. Competition in the mining market has continuously increased over time, leading the protocol difficulty to consistently rise. This growth has occurred despite the programmatic decline in new BTC issuance with each halving event. As a result, macro BTC rewards per hash have been in a long-term decline. Whilst miner incomes are denominated in BTC, their CAPEX and OPEX costs are largely denominated in fiat currencies. This makes miner effective revenue subject to price volatility. With such a large portion of the mining hardware offline and global production constraints on ASIC chip manufacture, the current mining market is finding itself slow to respond to elevated coin prices since 2020. There are simply fewer machines fighting over the same number of coins, trading at higher coin prices. As a result, miner USD revenue per hash has now risen back to July 2019 levels of $380k per hash, making operational miners exceptionally profitable on a historical basis.
Despite being a large sell-off/capitulation event last week, long-term holders and institutions haven’t budged an inch. Large entities (holding over $0.5B value) have ADDED to their balances. It appears that the only profit-taking occurring in the data is from (a) miners and (b) short-term holders. Coin dormancy has increased marginally, the variance is not at the levels seen during market tops historically. Liveliness is a metric that provides insights into shifts in macro HODLing behaviour, helping to identify trends in long term holder accumulation or spending. Liveliness has been trending downwards for the last month and has continued that trend today. Also, for the last 3 months, the percentage of BTC held on exchanges has been setting new 2 year lows, and it’s continued that trend in the last week. A lot of the data points to a potential supply squeeze eventually occurring in BTC (if nothing else changes).
We may still potentially see some panic selling in the short term, however keeping an eye on the future long-term potential of the crypto markets, an astute investor would want to HODL or see this as an opportunity to buy. While we may not be at the absolute bottom of this latest pullback, we are certainly near the bottom range.