BTC’s Developing Long Term Trends
News
|
Posted 26/04/2022
|
6535
Volatility and trading volume continue to compress across the Bitcoin market, as prices remain bound within the US$38k to $42k consolidation range. Market prices weakened slightly again this week, trading off a high of $42,893, and losing ground at a weekly low of $38,729.
The market has now traded within an increasingly tight price range for almost three months, leading to historically low yields available in futures markets cash-and-carry trades, alongside a persistent decline in trade volumes. Implied volatility priced into options markets has also broken below 60% this week, which is significantly lower than the 80%+ volatility that characterised much of 2021. Furthermore, transaction volumes on-chain remain muted, albeit with a growing trend of high value ($10M+) transactions, and a macro decline in volumes associated with exchange inflows and outflows.
A declining leverage ratio across all futures markets, despite increasing leverage in perpetual swaps, suggests that a reasonable volume of capital is leaving the Bitcoin market. This is further supported by the declining trade volumes.
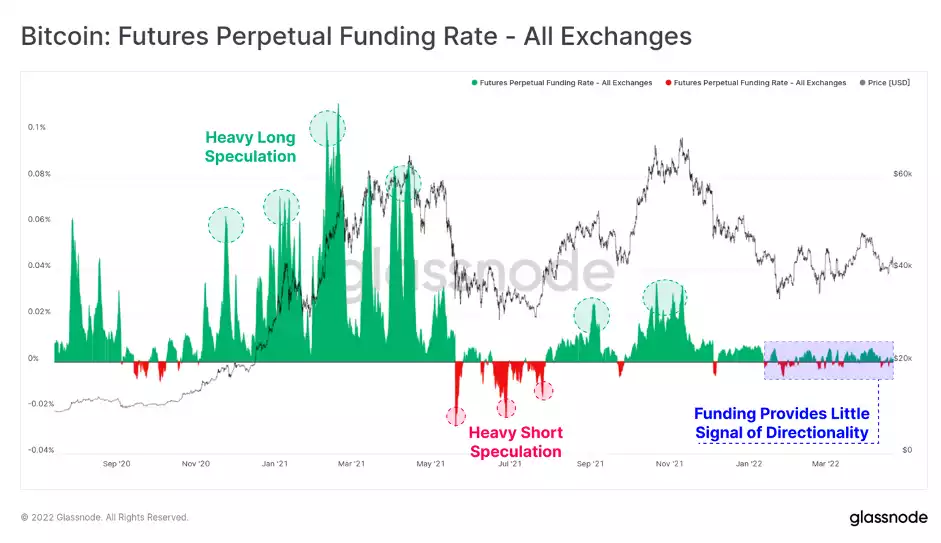
If we look at perpetual swap funding rates, we can see that the majority of 2022 has seen very low available yields and little directional bias. This is a stark contrast to the hyper-bullish long speculation in H1-2021 and again from Aug-Nov and periods of extreme bearishness in May-July 2021.
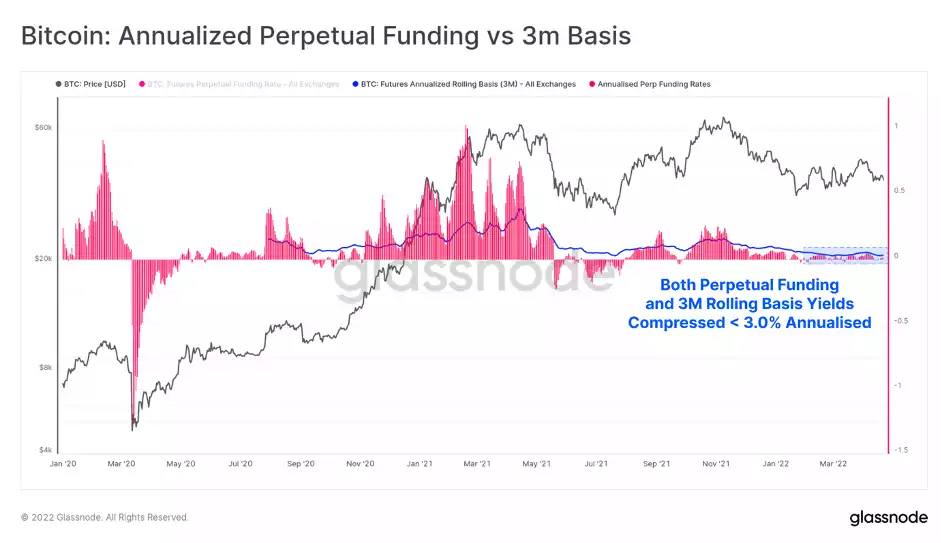
If we annualise the perpetual funding rate and compare it to the 3-month rolling basis available in calendar futures, we can see a likely reason behind why capital is rotating out of Bitcoin markets.
Yields available in futures markets have compressed to levels barely above 3.0%, which is hardly superior to the yield available from a 10y US treasury bond (2.9%), and significantly lower than the recent US CPI inflation print of 8.5%. It is likely that declining trade volumes and lower aggregate open interest is a symptoms of capital flowing out of Bitcoin derivatives, and towards higher yield, and potentially lower perceived risk opportunities.
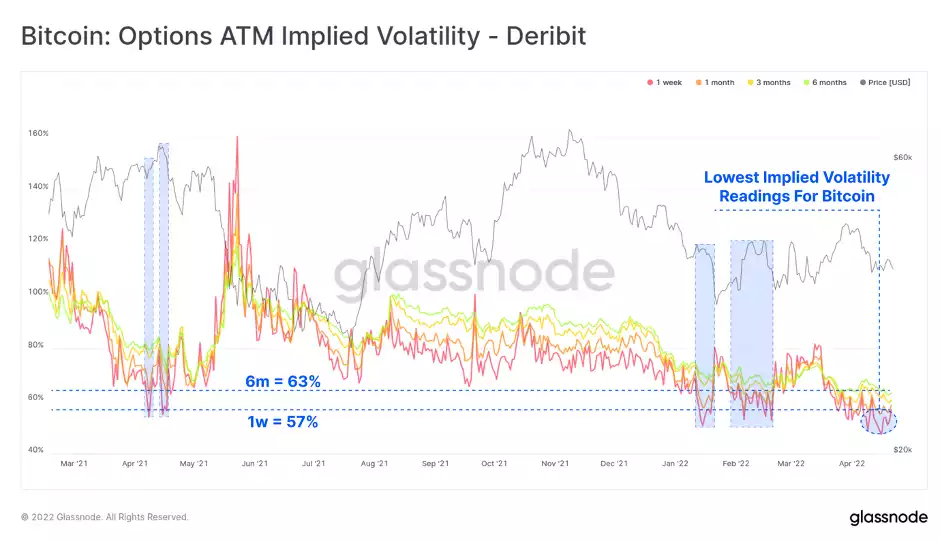
We can also see that options markets are pricing in historically low implied volatility, breaking below 60% over the past few weeks. There are very few instances in the last year where implied volatility has been this low, most of which is during the current consolidation range which has contained almost all of the year-to-date price action.
With low implied volatility in options markets, options short sellers are in a similar, low yield boat, as cash-and-carry futures traders.
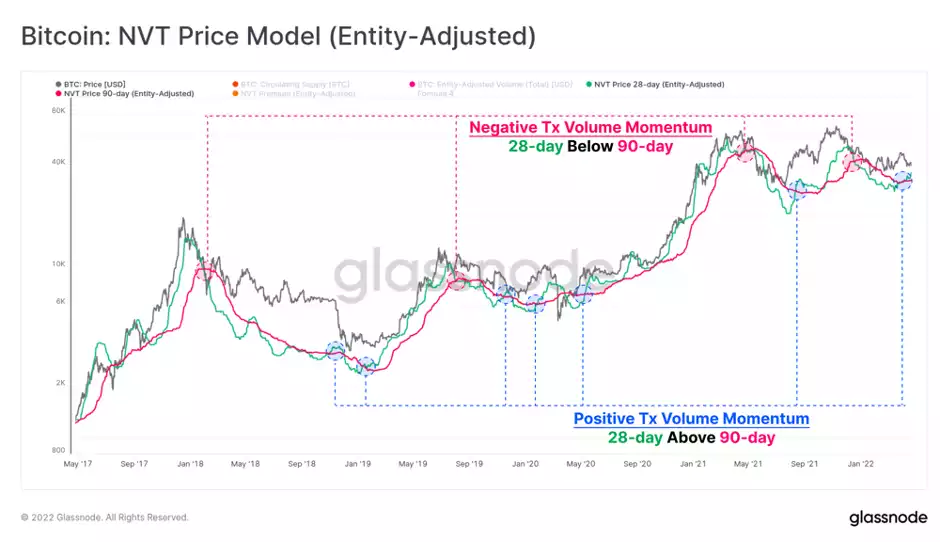
Finally, we can take the observations of aggregate transaction volumes, and model them as a fundamental pricing model, via a methodology first proposed by Willy Woo. The NVT price model takes the 2-year median of the NVT Ratio and multiplies it by the current transaction volume. The resulting model thus establishes an implied valuation based on the current utilisation levels of Bitcoin for value settlement.
A 28-day (green) and 90-day (pink) period are used to establish a fast and slow signal respectively. These two models currently value Bitcoin between $32.5k (90-day) and $36.1k, with both starting to bottom out and potentially reverse. Of note is the recent positive momentum cross-over, with the faster 28-day breaking above the 90-day.
Historically, such cross-overs have been a constructive medium to long term signals. However, as shown in blue below, these signals do require the confirmation of a time to properly prove that positive momentum is in play. Greater value settlement on-chain would trigger both of these models to increase, implying stronger underlying fundamentals (and vice-versa is also true).
Despite on-chain settlement volumes being similarly muted, there is a growing (but early) trend of strength developing in underlying fundamentals. Transactions larger than $10M have sustained ~40% dominance since late 2020, and the dominance of speculative exchange inflows and outflows, often associated with bull markets, appears to be in decline.
Implied valuations of the NVT price model remain in the low to mid $30k region, which does indicate the bulls have their work cut out for them. However, these models are perhaps starting to bottom out and reverse, which is a trend worth keeping an eye on over the coming weeks.