A Confusing Time for Crypto
News
|
Posted 22/06/2021
|
6851
The last few weeks of crypto have been a rollercoaster. We have seen amazing news from El Salvador making Bitcoin a legal tender just this morning seeing that MicroStrategy has purchased a further 13,005 BTC ($550m), increasing their holdings to 105,085 BTC ($4.4b). Despite all this positive news, the price continues to go down. So, what's going on?
Over the last year, BTC is up 250%. Ethereum is up 760%. Of course, both are down a lot over the last month or so. That’s just how this market runs – the money rolls in and out.
Price is meant to be a summary of the views and opinions of all market participants. So, what is the story that the price and sentiment data telling us?
At the market top, retail investors were heavily leveraged and as they hit stop losses and margin calls, the price plummeted. The phase that we are going through now is the aftermath of this occurrence. The interconnected nature of leverage and Bitcoin's status as the store of value has retail actors selling off well-performing but non-core assets to park whatever remains into Bitcoin. As the market overall has become bearish, selling off winners to pay off collateral calls or to turn off risk starts making sense.
Bitcoin is larger than Visa and its network market capitalisation, now worth more than $600 billion. Ethereum is more valuable than Goldman Sachs, at over $200 billion. The value of crypto networks floats somewhere in the hundreds of millions, to the tens of billions. Simply put, it is harder to grow fast from a larger base than from a smaller base. This is another reason for correlations to converge slightly more with traditional markets – especially as the space further looks to competing or taking over sectors of the traditional market.
Bitcoin is digitally scarce and can be viewed as rigid money. The rigidity refers to how difficult it is to create additional units of the currency. While Chinese authorities may attempt to stomp out Bitcoin mining, this does little to change the network’s ability to secure transactions and generate a store of wealth for people. So, the recent FUD surrounding China is nothing more than that – FUD – Fear Uncertainty and Doubt. Besides, China ‘bans crypto’ with laughable regularity.
What are the technical models telling us?
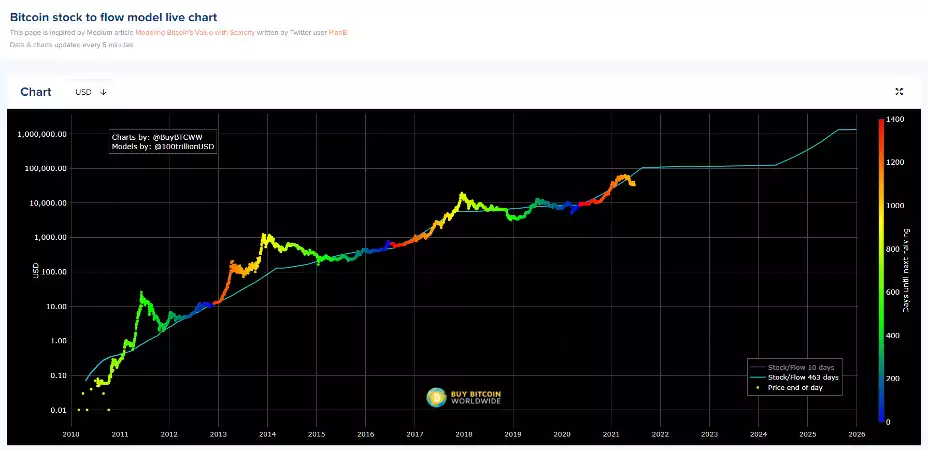
The Bitcoin stock to flow model takes the schedule of BTC emissions with its halving events and overlaps it nicely on a logarithmic scale with the BTC price. The logic is that the harder it is to generate the next Bitcoin (and hence less new supply), the higher the price of Bitcoin will be. We currently sit below where the models predict the price should be.

There are also various analytics about which types of accounts are selling (e.g., large or small), institutional inflows and outflows, and other leading indicators to transaction count. At the moment the data shows that "whales" aren't budging, all the recent selling has been smaller accounts and that we are just "cooling off" from the euphoric phase of the last run-up.
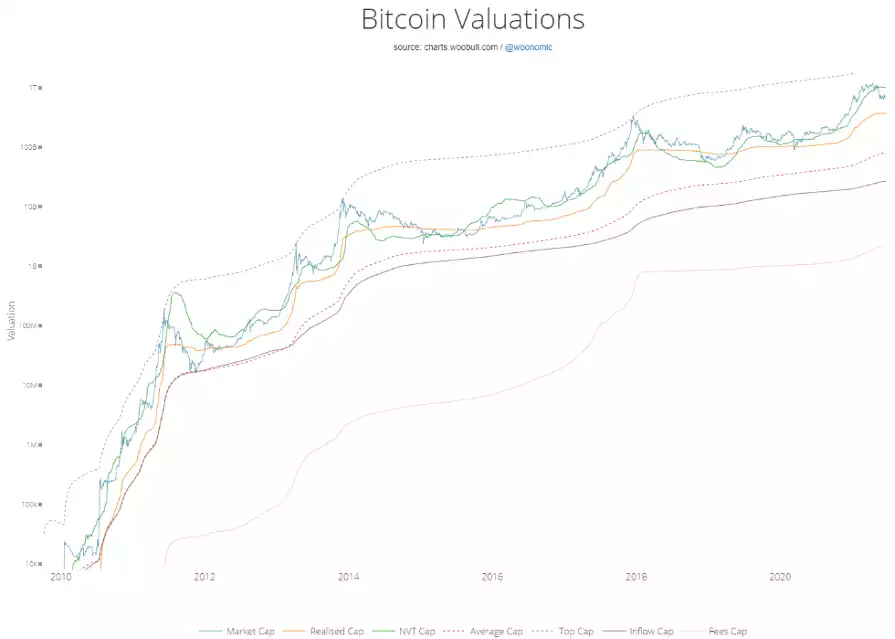
Another one of the better models for understanding the current valuation of BTC is Willy Woo’s NVT model. The NVT cap, which is based on historic money flows relative to network value, and suggests Bitcoin should be worth over $1 trillion. The value of all coins at the price of their last transaction is $370 billion, nearly a third. The market is currently floating somewhere in the middle of this model.

Then add the levels of money printing and inflation numbers in the United States, and the crypto market still doesn’t budge. There are a variety of factors at play in this market at the moment but don't forget what the real valuation argument is. It's clear that the big money still sees huge value in the crypto market – just check out this tweet from Michael Saylor this morning if you need a confidence boost:
